Open Access
Fig. 9
Download original image
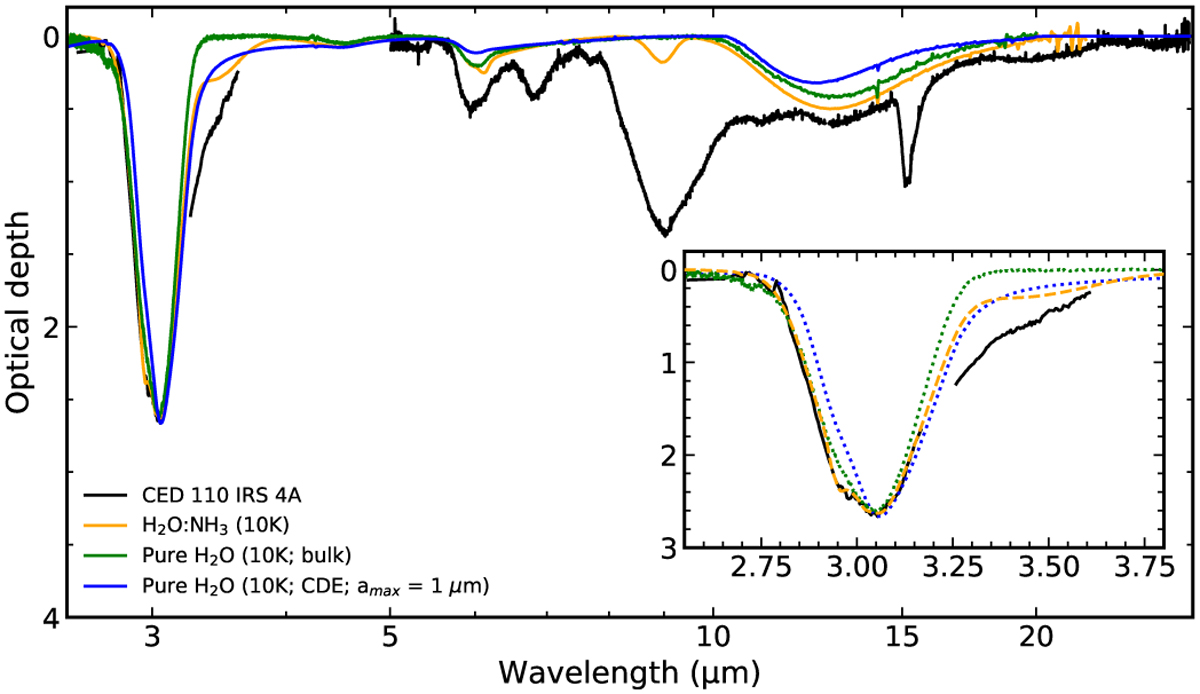
H2O ice IR data compared with the optical depth spectrum of Ced 110 IRS4A prior silicate subtraction. The green and orange lines represent the pure H2O bulk ice and H2O:NH3 spectra. Blue shows the CDE-corrected ice spectra of pure H2O ice. The inset panel shows a zoom-in of the 3 µm band.
Current usage metrics show cumulative count of Article Views (full-text article views including HTML views, PDF and ePub downloads, according to the available data) and Abstracts Views on Vision4Press platform.
Data correspond to usage on the plateform after 2015. The current usage metrics is available 48-96 hours after online publication and is updated daily on week days.
Initial download of the metrics may take a while.