Open Access
Fig. D.2
Download original image
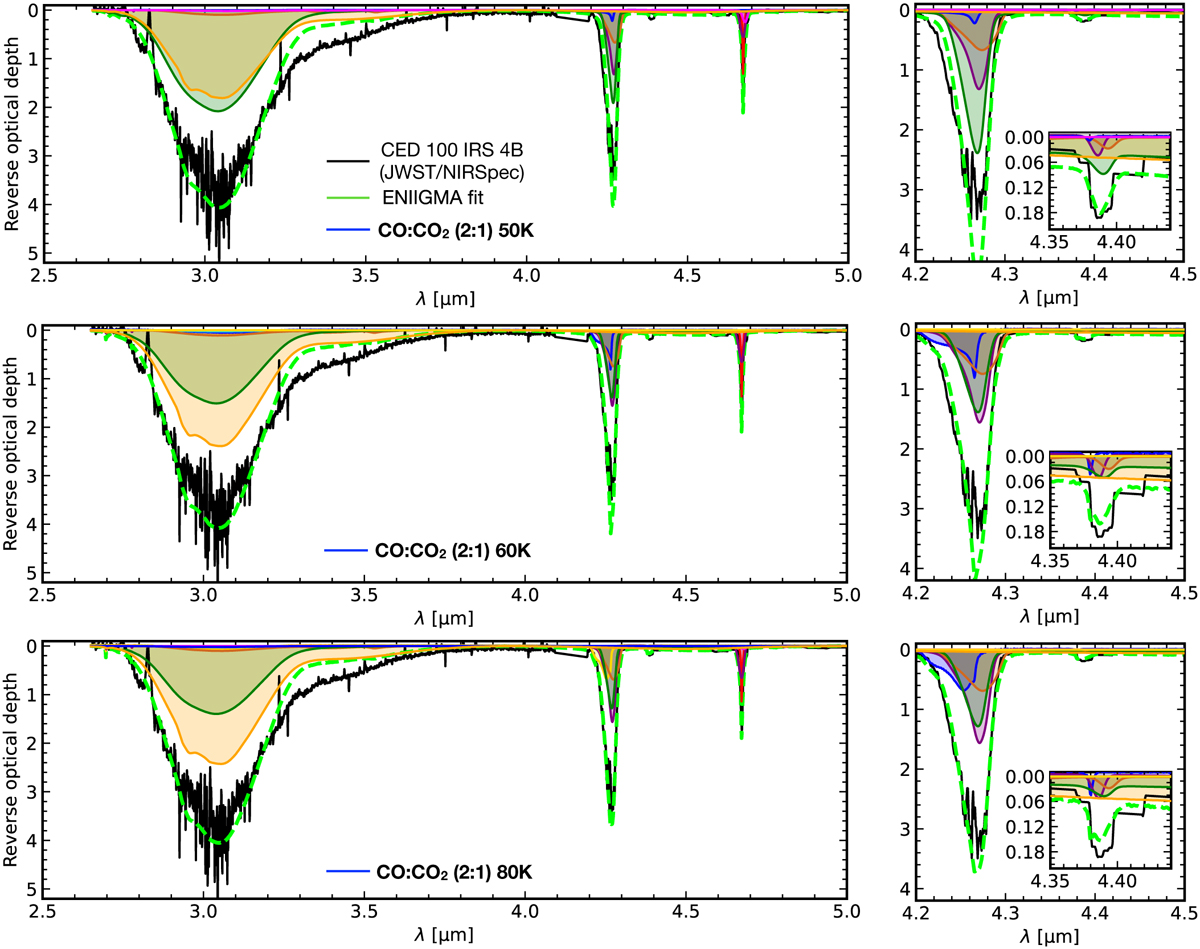
ENIIGMA fits of the NIRSpec range of Ced 110 IRS4B by assuming IR spectra of the CO:CO2 ice mixture at 50 (top), 60 (middle) and 80 K (bottom). Left panels shows the full spectral range, and the right plots show a zoom-in of the1 2CO2 and 13CO2 ice absorption features.
Current usage metrics show cumulative count of Article Views (full-text article views including HTML views, PDF and ePub downloads, according to the available data) and Abstracts Views on Vision4Press platform.
Data correspond to usage on the plateform after 2015. The current usage metrics is available 48-96 hours after online publication and is updated daily on week days.
Initial download of the metrics may take a while.