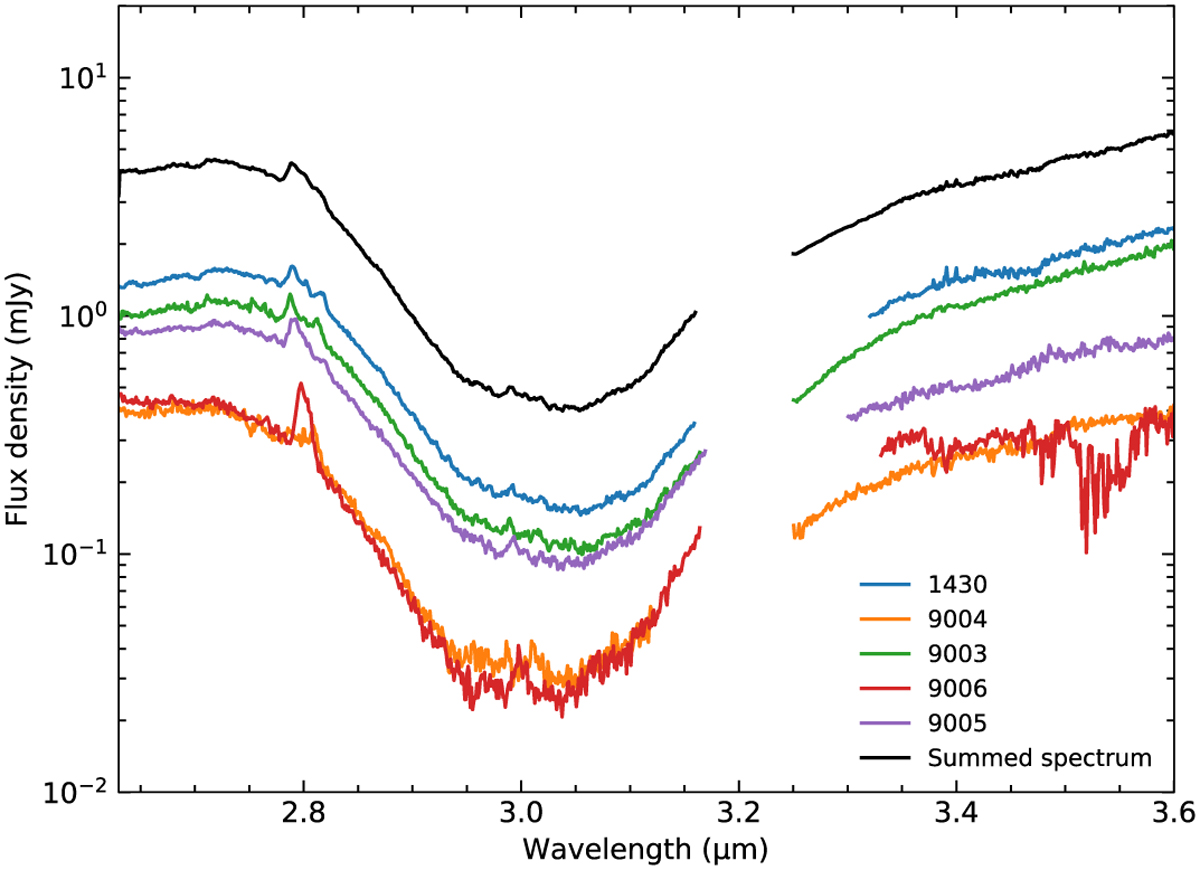
Fig. A.1
Download original image
Extracted spectrum using the PSF method of different regions around Ced 110 IRS4A as indicated in Figure 2. Individual spectra are shown in colour and the sum of these individual data is presented in black. While the emission line at 2.8 µm is due to H2O(3) line, the strong absorption features at 3.55 µm in the region 9006 (red) is due to extraction artifact.
Current usage metrics show cumulative count of Article Views (full-text article views including HTML views, PDF and ePub downloads, according to the available data) and Abstracts Views on Vision4Press platform.
Data correspond to usage on the plateform after 2015. The current usage metrics is available 48-96 hours after online publication and is updated daily on week days.
Initial download of the metrics may take a while.