Fig. 2
Download original image
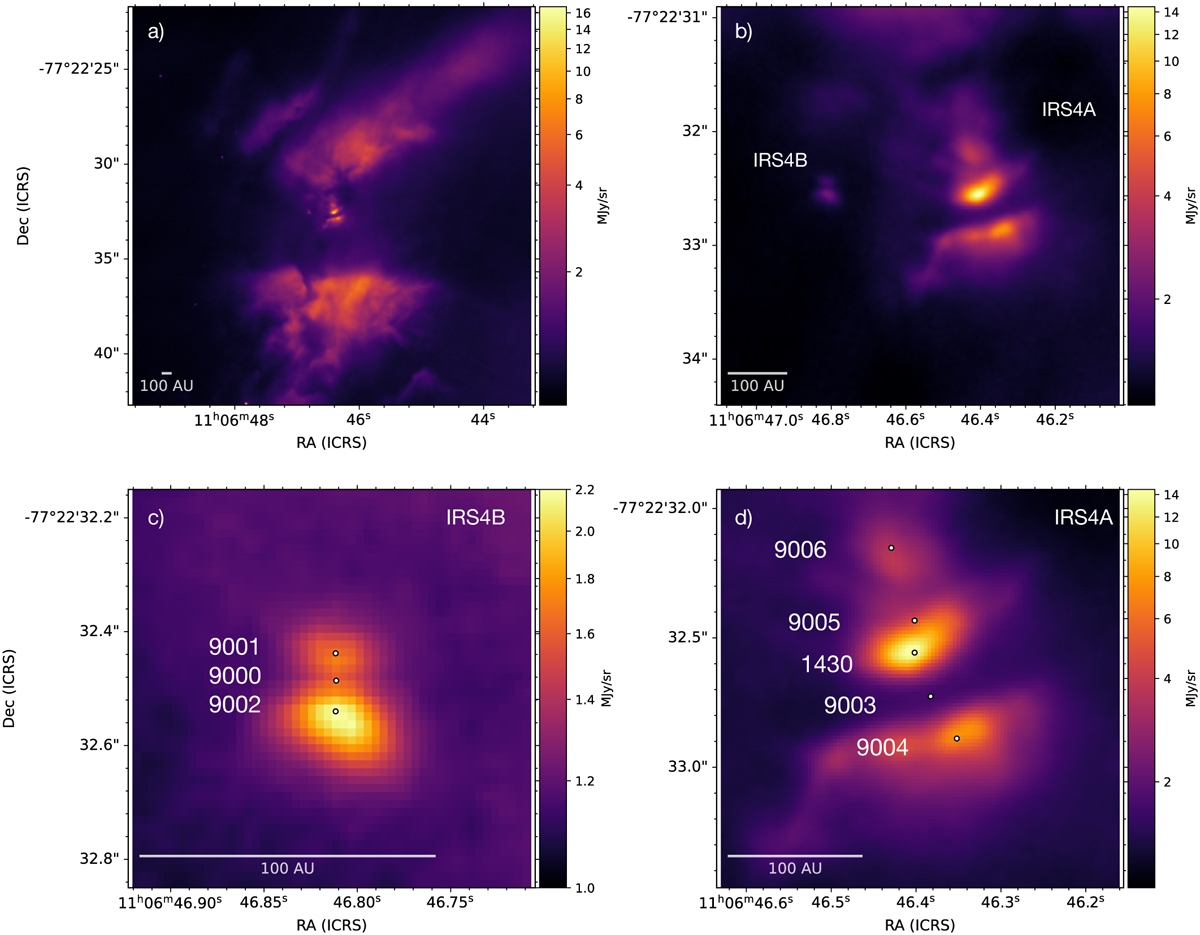
NIRCam image at 1.5 µm of Ced 110 IRS4A and IRS4B. Panel a displays the large scale image of the Ced 110 IRS4 system and panel b shows a zoom in panel a. Panels c and d highlight the IRS4B and IRS4A source morphologies, respectively. The small white circles show the starting positions of the PSF extractions and the numbers are identifications of the individual spectra shown in Figure A.1.
Current usage metrics show cumulative count of Article Views (full-text article views including HTML views, PDF and ePub downloads, according to the available data) and Abstracts Views on Vision4Press platform.
Data correspond to usage on the plateform after 2015. The current usage metrics is available 48-96 hours after online publication and is updated daily on week days.
Initial download of the metrics may take a while.