Open Access
Fig. 19
Download original image
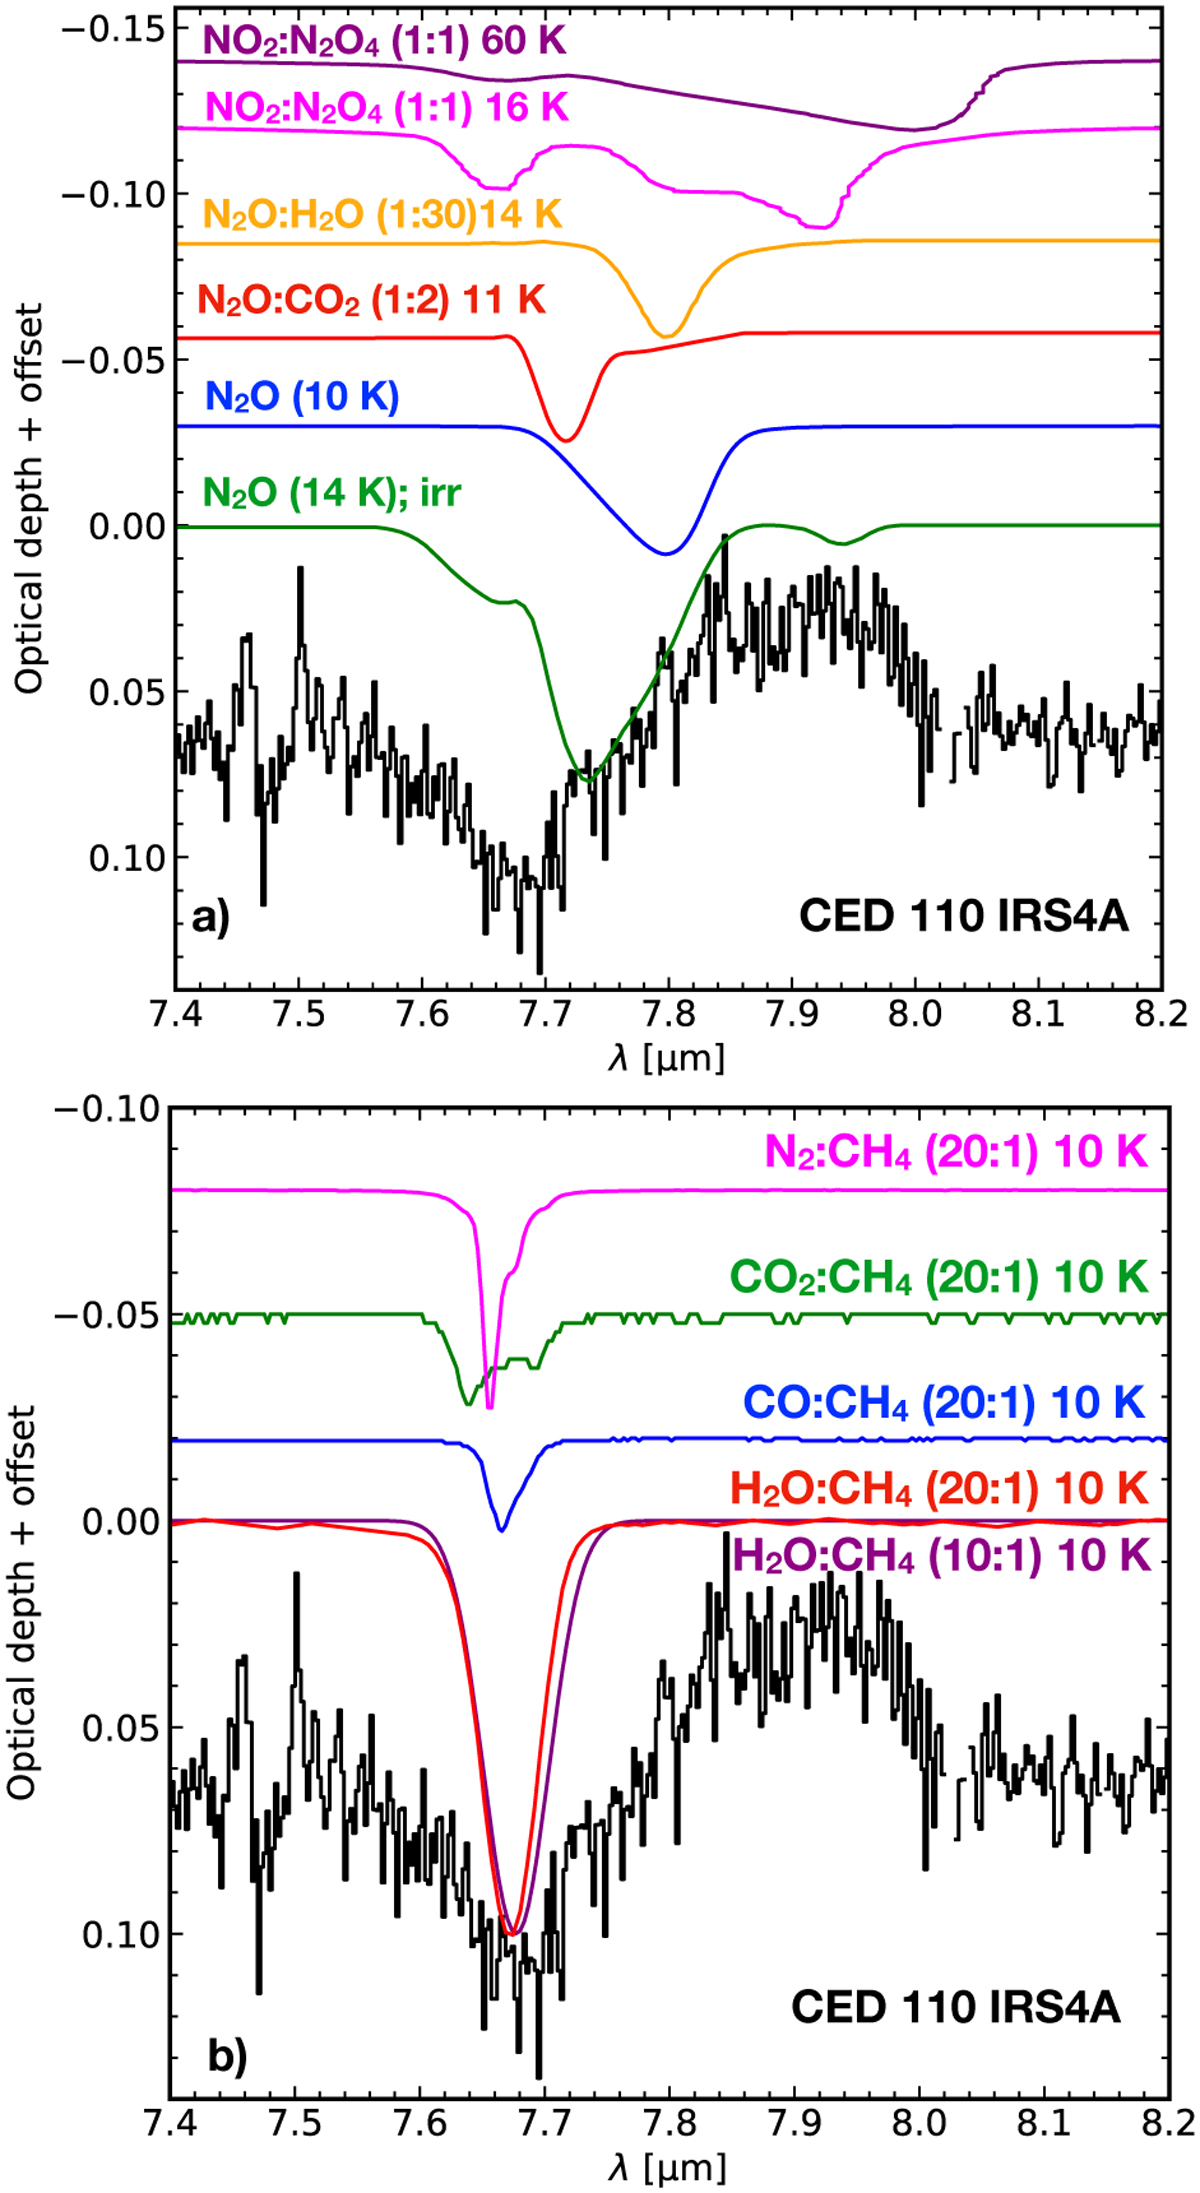
N2O IR ice spectra from different experiments compared with the optical depth spectrum of Ced 110 IRS4A between 7.4 and 8.2 µm. The panel a displays IR features of nitrogen oxides ice data, whereas the panel b shows the CH4 ice band mixed with other molecules.
Current usage metrics show cumulative count of Article Views (full-text article views including HTML views, PDF and ePub downloads, according to the available data) and Abstracts Views on Vision4Press platform.
Data correspond to usage on the plateform after 2015. The current usage metrics is available 48-96 hours after online publication and is updated daily on week days.
Initial download of the metrics may take a while.