Open Access
Fig. 15
Download original image
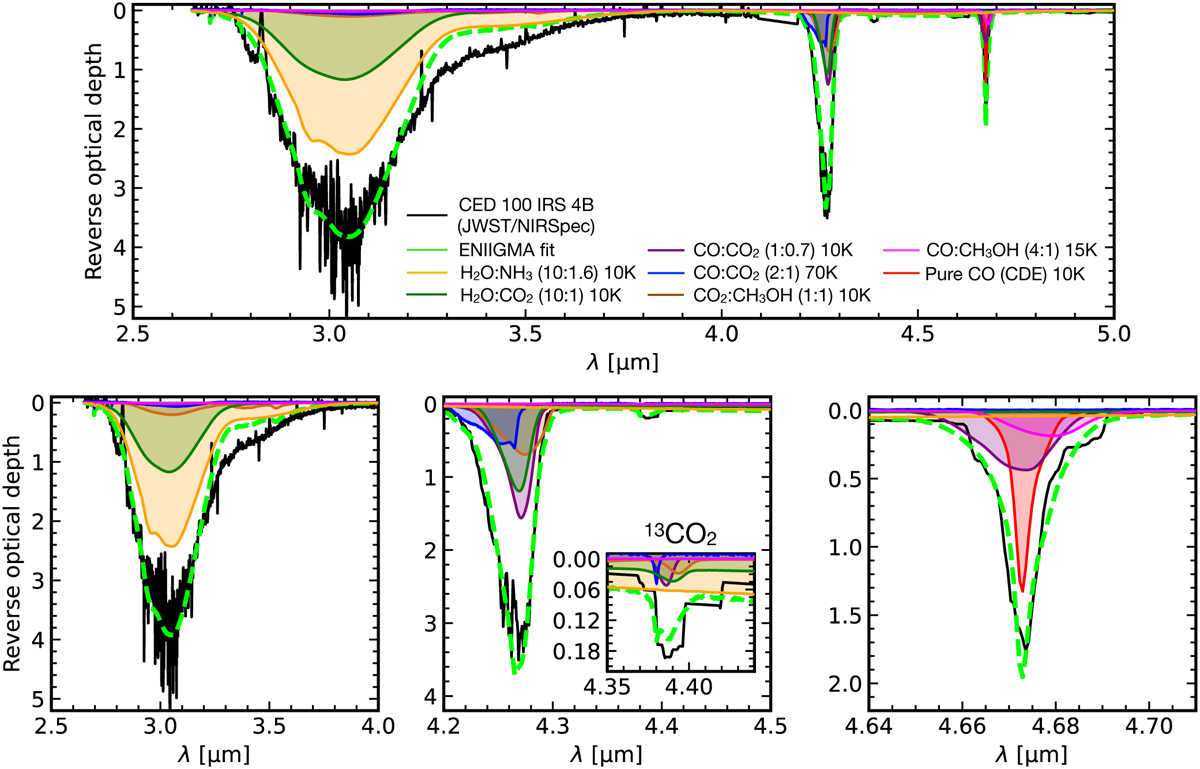
ENIIGMA fit (green) between 2.5 and 5 µm of the Ced 110 IRS4B spectrum (black). Top panel shows the global fit, and bottom panels displays details of specific regions, namely, H2O, CO2, and CO.
Current usage metrics show cumulative count of Article Views (full-text article views including HTML views, PDF and ePub downloads, according to the available data) and Abstracts Views on Vision4Press platform.
Data correspond to usage on the plateform after 2015. The current usage metrics is available 48-96 hours after online publication and is updated daily on week days.
Initial download of the metrics may take a while.