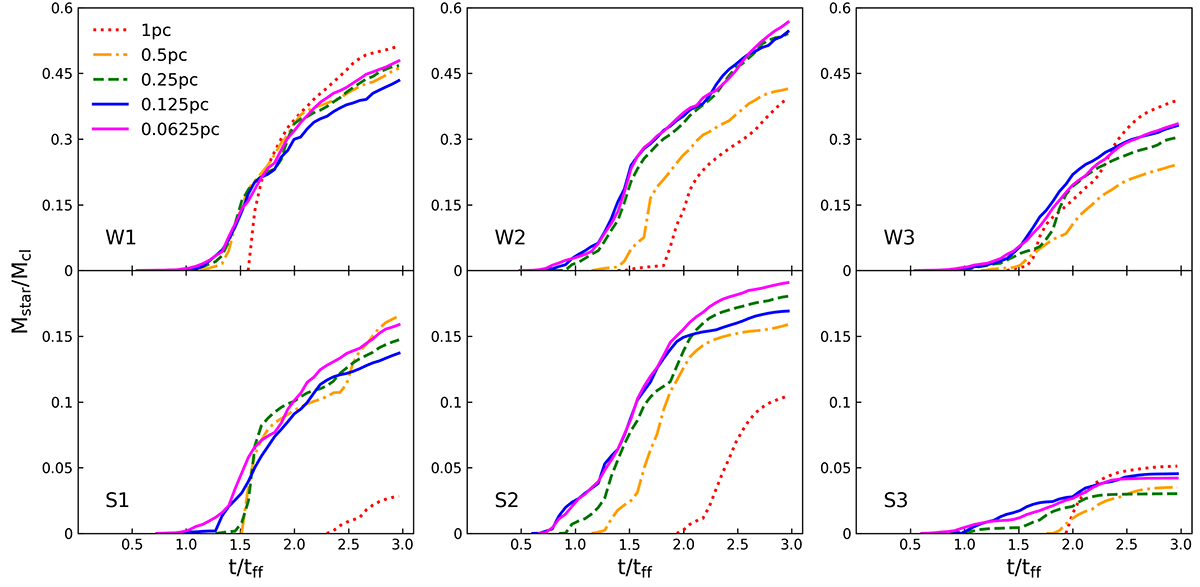
Fig. A.4.
Download original image
Total SFE (Mstar/Mcl) in six different GMCs. The clouds with weak and strong turbulence are plotted in the top and bottom panels, respectively. Different columns correspond to simulations with different random seeds for turbulence driving. Simulations with different resolutions are shown in different colors and line styles, as indicated in the legend. The star formation efficiency converges from runs with a resolution of ∼0.25 pc.
Current usage metrics show cumulative count of Article Views (full-text article views including HTML views, PDF and ePub downloads, according to the available data) and Abstracts Views on Vision4Press platform.
Data correspond to usage on the plateform after 2015. The current usage metrics is available 48-96 hours after online publication and is updated daily on week days.
Initial download of the metrics may take a while.