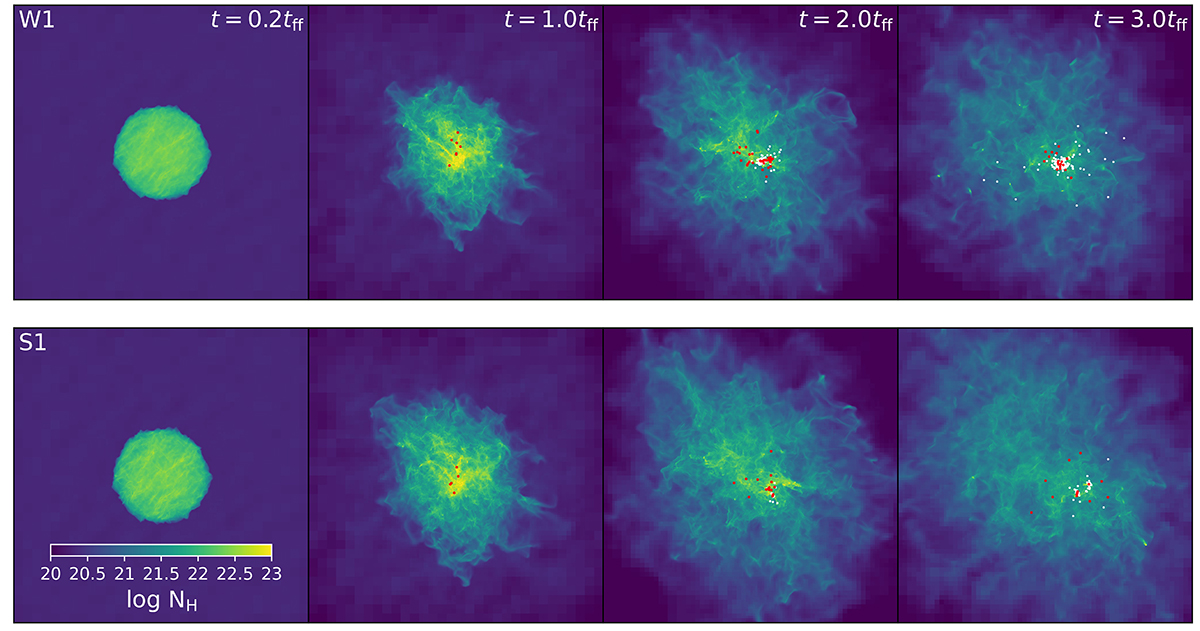
Fig. A.3.
Download original image
Evolution of GMCs with weak (W1, top) and strong (S1, bottom) turbulence. Different columns show the hydrogen column density distribution at four different epochs. The red and white dots represent sink and star particles, respectively. Each panel measures 128 pc on a side and the maximum resolution of the simulations is 0.0625 pc. No stellar feedback is included.
Current usage metrics show cumulative count of Article Views (full-text article views including HTML views, PDF and ePub downloads, according to the available data) and Abstracts Views on Vision4Press platform.
Data correspond to usage on the plateform after 2015. The current usage metrics is available 48-96 hours after online publication and is updated daily on week days.
Initial download of the metrics may take a while.