Open Access
Fig. 11.
Download original image
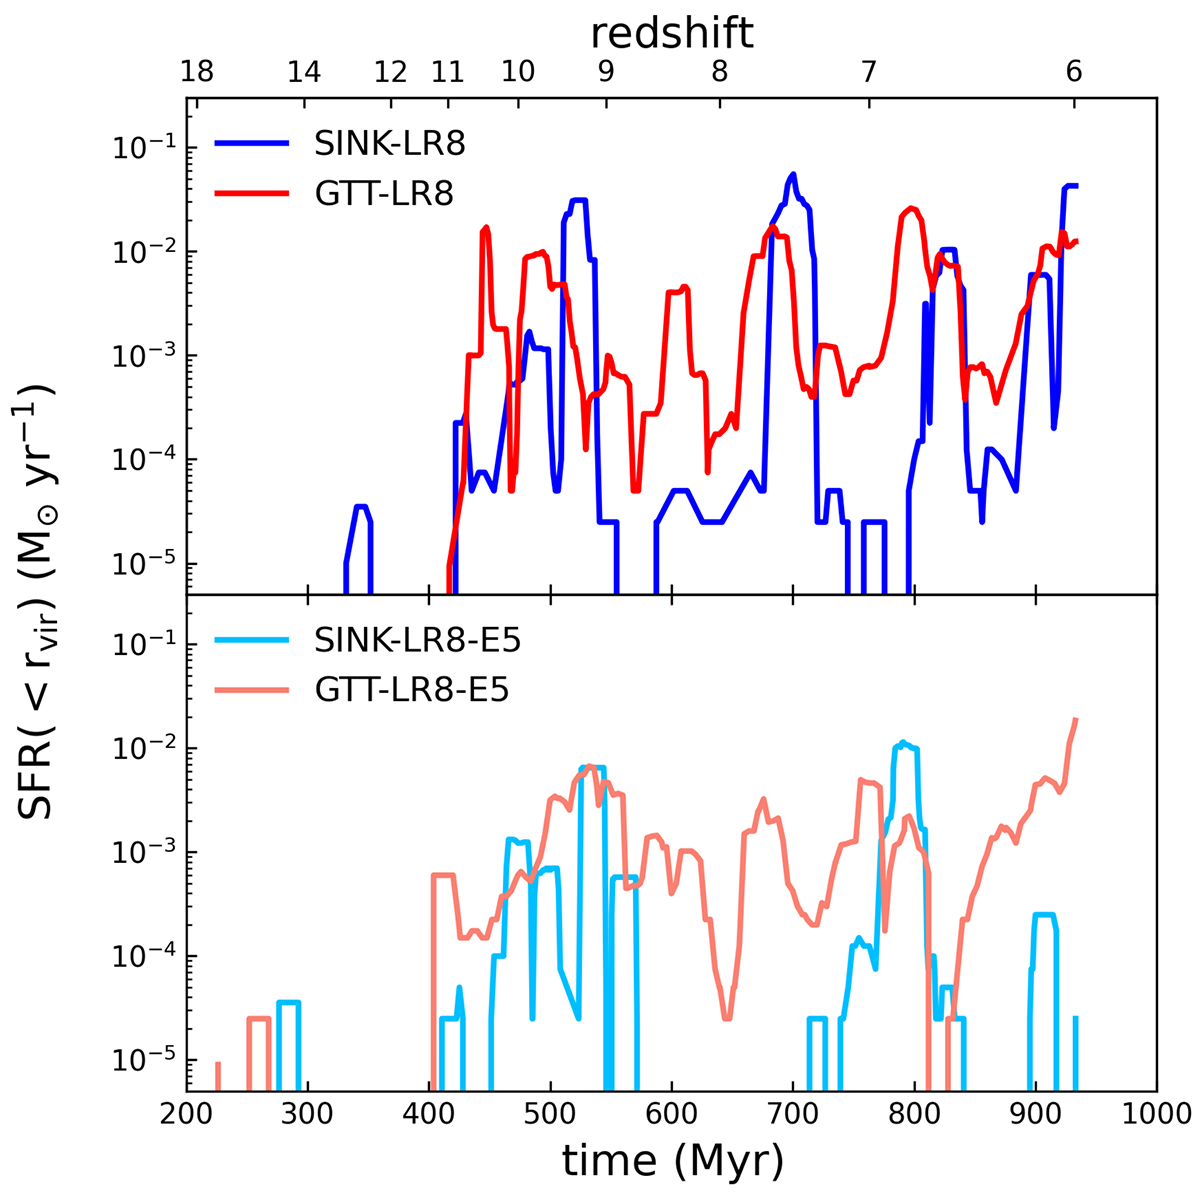
Star formation rates in the E1 (top) and E5 runs (bottom). SFR are averaged over a 20 Myr timescale. We find that star formation is still more bursty in the SINK run than in the GTT run, even when the SN energy is artificially increased.
Current usage metrics show cumulative count of Article Views (full-text article views including HTML views, PDF and ePub downloads, according to the available data) and Abstracts Views on Vision4Press platform.
Data correspond to usage on the plateform after 2015. The current usage metrics is available 48-96 hours after online publication and is updated daily on week days.
Initial download of the metrics may take a while.