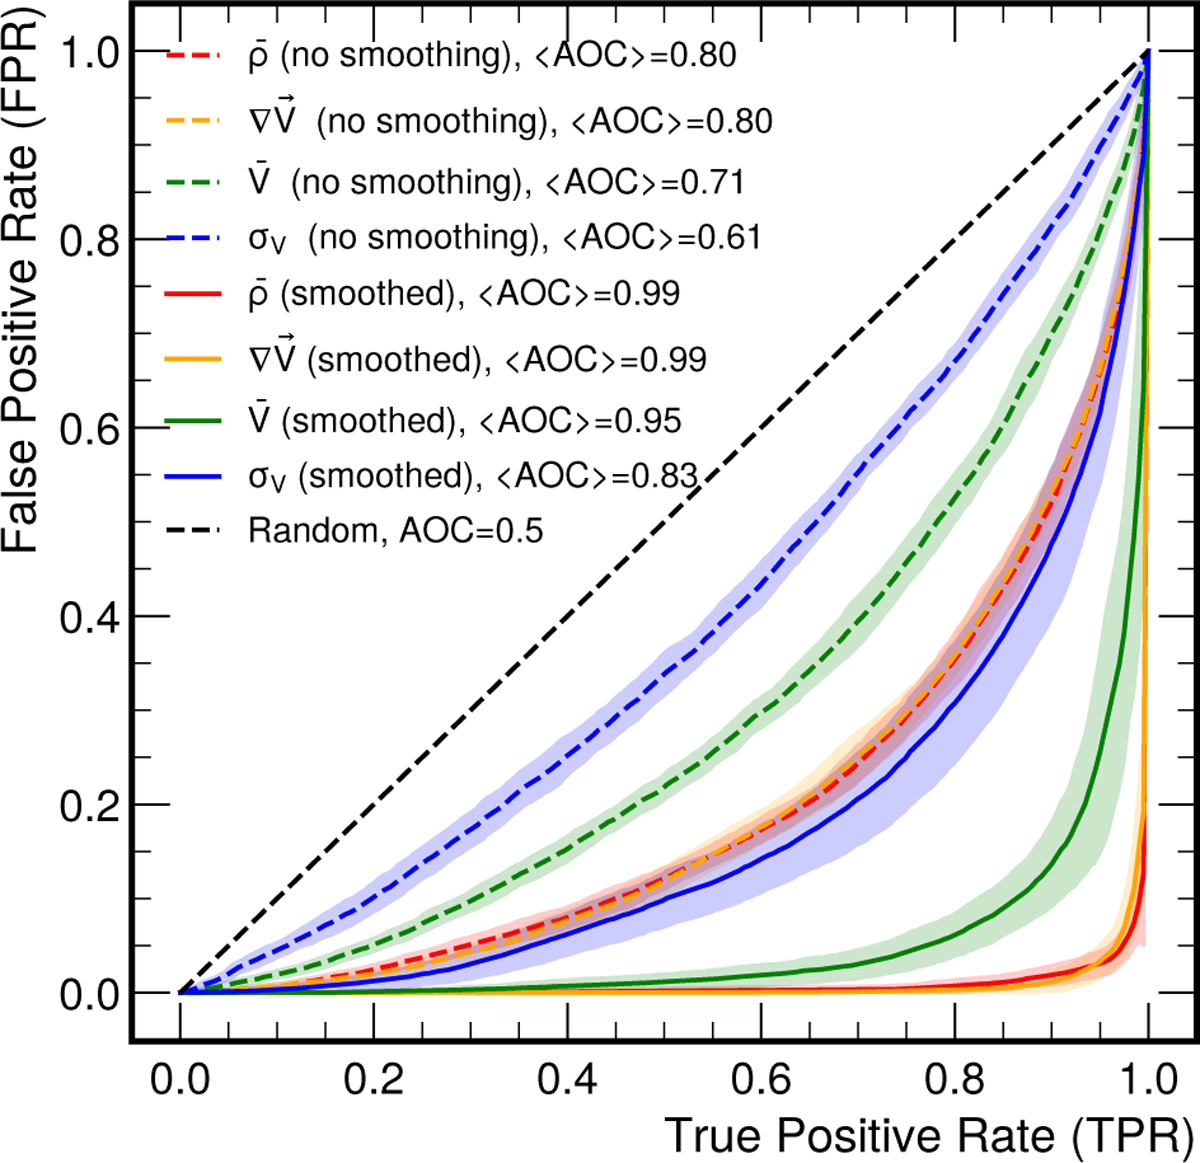
Fig. 5

Download original image
Binary classifier performance for 5 × 10⁸ M⊙ when training on images generated from the middle slice (Z ∈ [−20, 20] kpc) of the simulation box. The different coloured bands depict the performance when training on different features: red – overdensity, yellow – divergence, green – mean speed, and blue – speed dispersion. Model performance where training was done on Gaussian smoothed features is depicted by the solid lines, whereas dashed lines show when training was done on unsmoothed features. We observed that best performance is achieved by using smoothed features out of which overdensity and velocity divergence are most effective.
Current usage metrics show cumulative count of Article Views (full-text article views including HTML views, PDF and ePub downloads, according to the available data) and Abstracts Views on Vision4Press platform.
Data correspond to usage on the plateform after 2015. The current usage metrics is available 48-96 hours after online publication and is updated daily on week days.
Initial download of the metrics may take a while.


