Fig. 2
Download original image
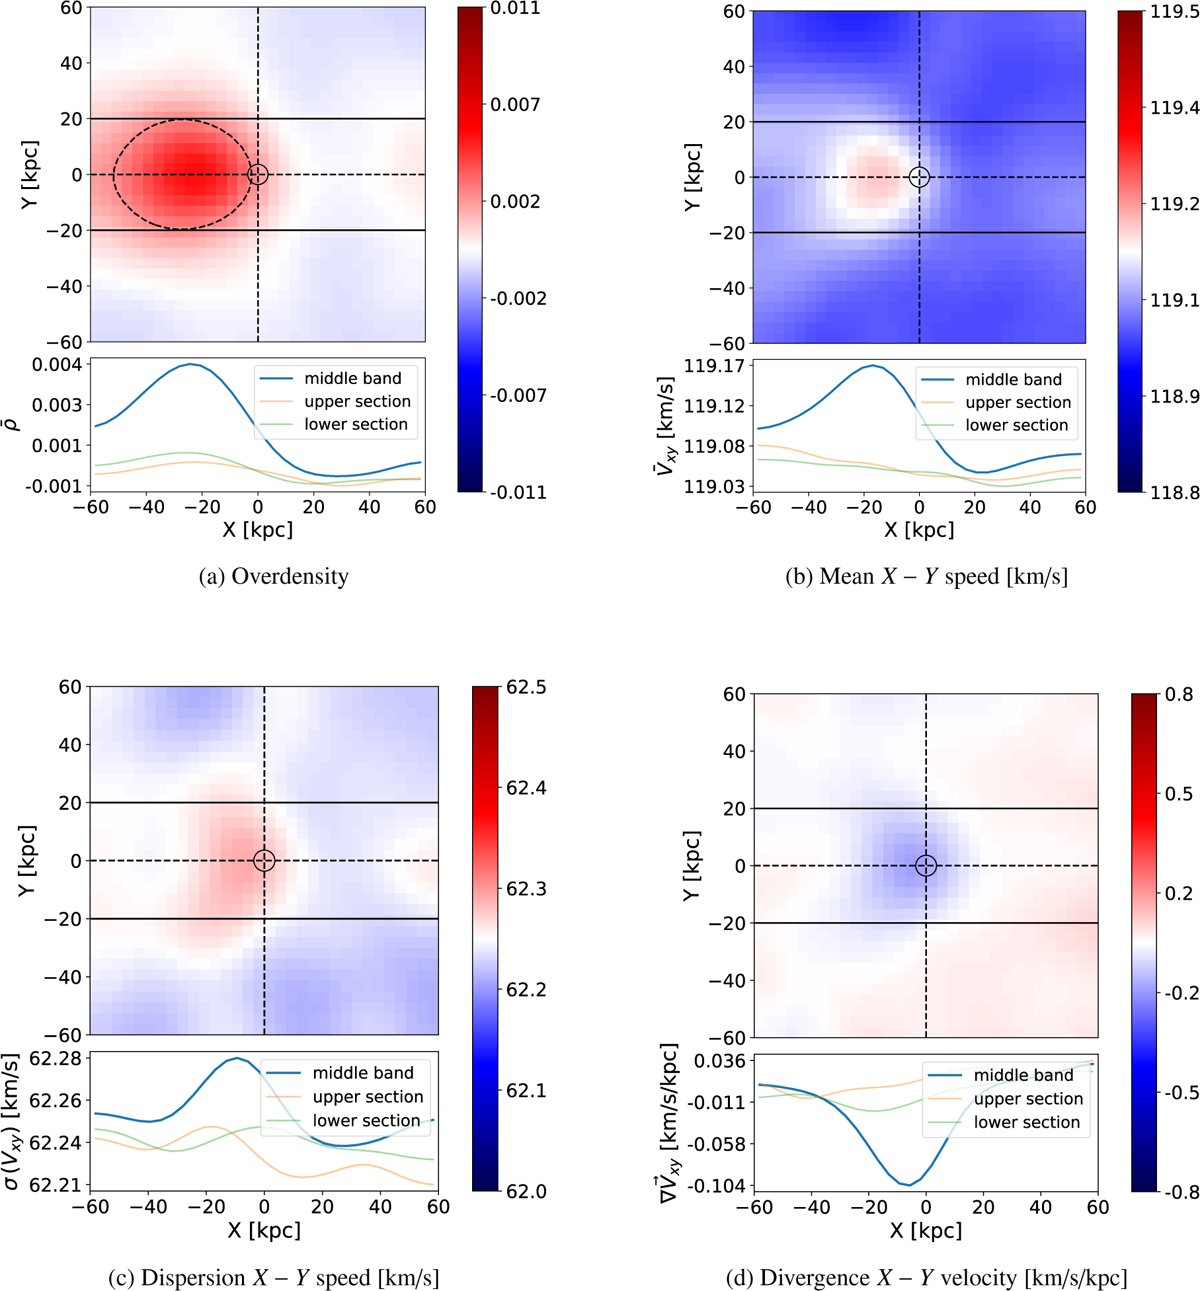
Stellar phase-space feature maps shown in the reference frame of the simulation box (i.e. frame at which the perturber is moving from left to right with an initial speed of 225 km/s) extracted from a simulation with a perturber of mass 5 × 10⁸ M⊙ after an integration time t = 194.94 Myr. We note that in the simulation box’s reference frame, the average (unperturbed) 3D velocity of the wind is 0 km/s, and its average (unperturbed) speed in the X − Y plane is 119 km/s. The maps are generated from data contained in a z-slice of ɀ ∈ [−20, 20] kpc. Panel a: Overdensity. Panel b: mean speed. Panel c: speed dispersion. Panel d: divergence. The panels show the Gaussian-smoothed features projected onto the X − Y plane. Inside the dashed contour of panel a, we show the half-max region of the overdensity. Each subfigure includes a lower plot that shows each Y-band’s radial profile along the X-axis. The perturber is situated in the middle of the histogram, with the black circle depicting its scale radius. We observed that the wake effects are seen in all four of the phase-space features.
Current usage metrics show cumulative count of Article Views (full-text article views including HTML views, PDF and ePub downloads, according to the available data) and Abstracts Views on Vision4Press platform.
Data correspond to usage on the plateform after 2015. The current usage metrics is available 48-96 hours after online publication and is updated daily on week days.
Initial download of the metrics may take a while.