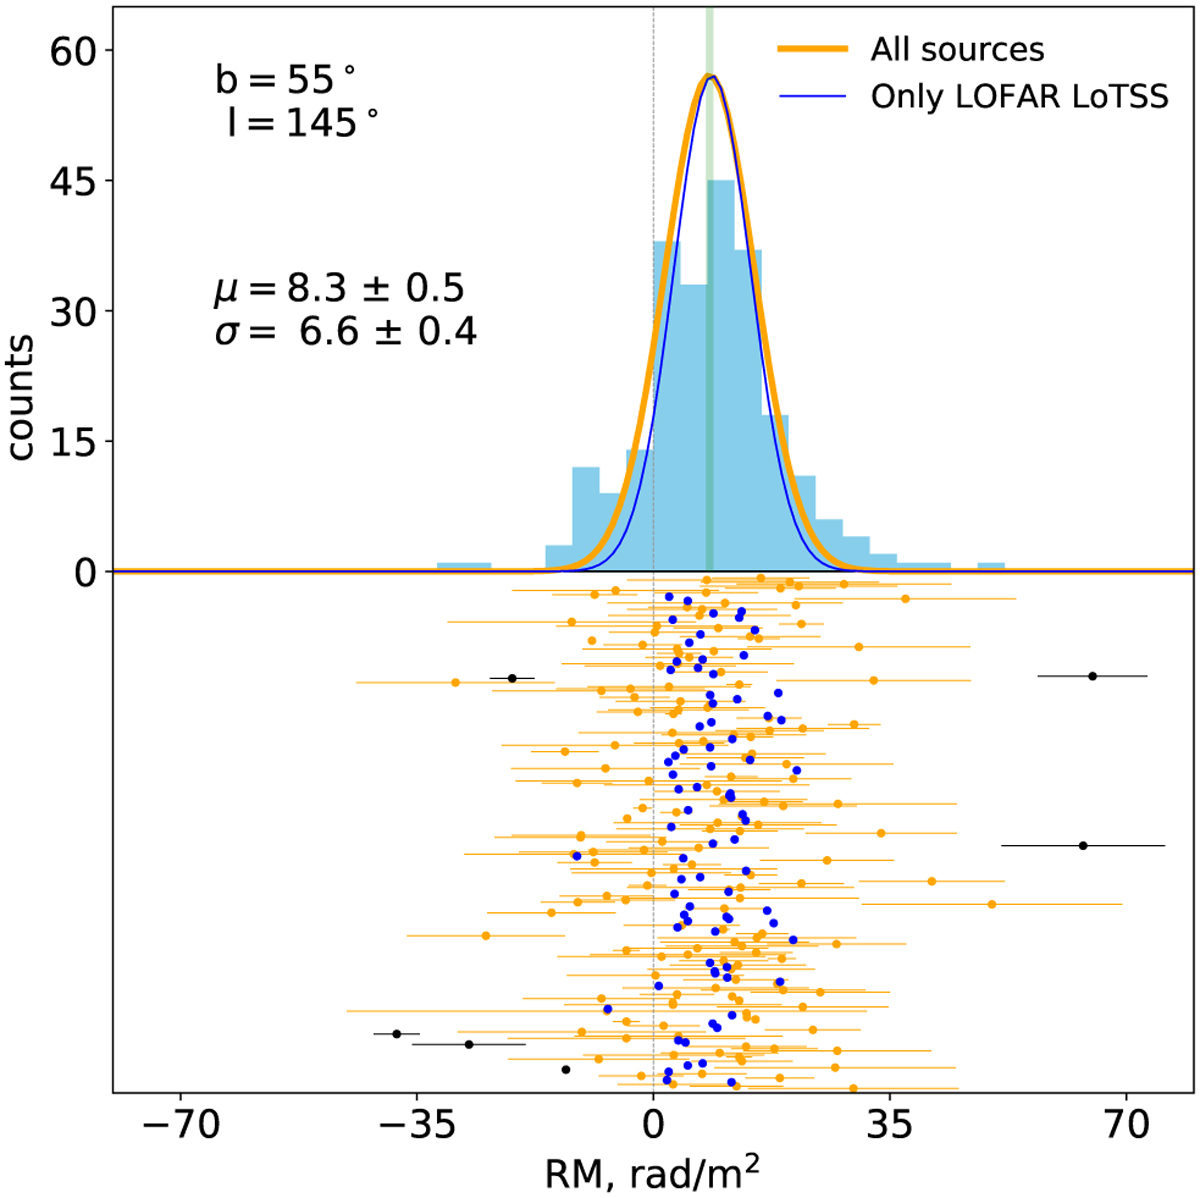
Fig. A.1
Download original image
Example of RM bin fitted with the gaussian. Points at the bottom of the figure indicate individual measurements within the bin together with their observational errors. Black points were discarded as outlier during the fit, blue points mark the LOFAR LoTSS data and orange points mark all other data. Blue boxes show the histogram of all sources except for outliers. Orange curve is the gaussian obtained as a result of the fit to all data (including LOFAR) and the pale green band is 68% confidence interval of its µ. The parameters of this gaussian are indicated on the plot. The blue curve is the best-fit gaussian if only LOFAR LoTSS data is used.
Current usage metrics show cumulative count of Article Views (full-text article views including HTML views, PDF and ePub downloads, according to the available data) and Abstracts Views on Vision4Press platform.
Data correspond to usage on the plateform after 2015. The current usage metrics is available 48-96 hours after online publication and is updated daily on week days.
Initial download of the metrics may take a while.