Fig. 4
Download original image
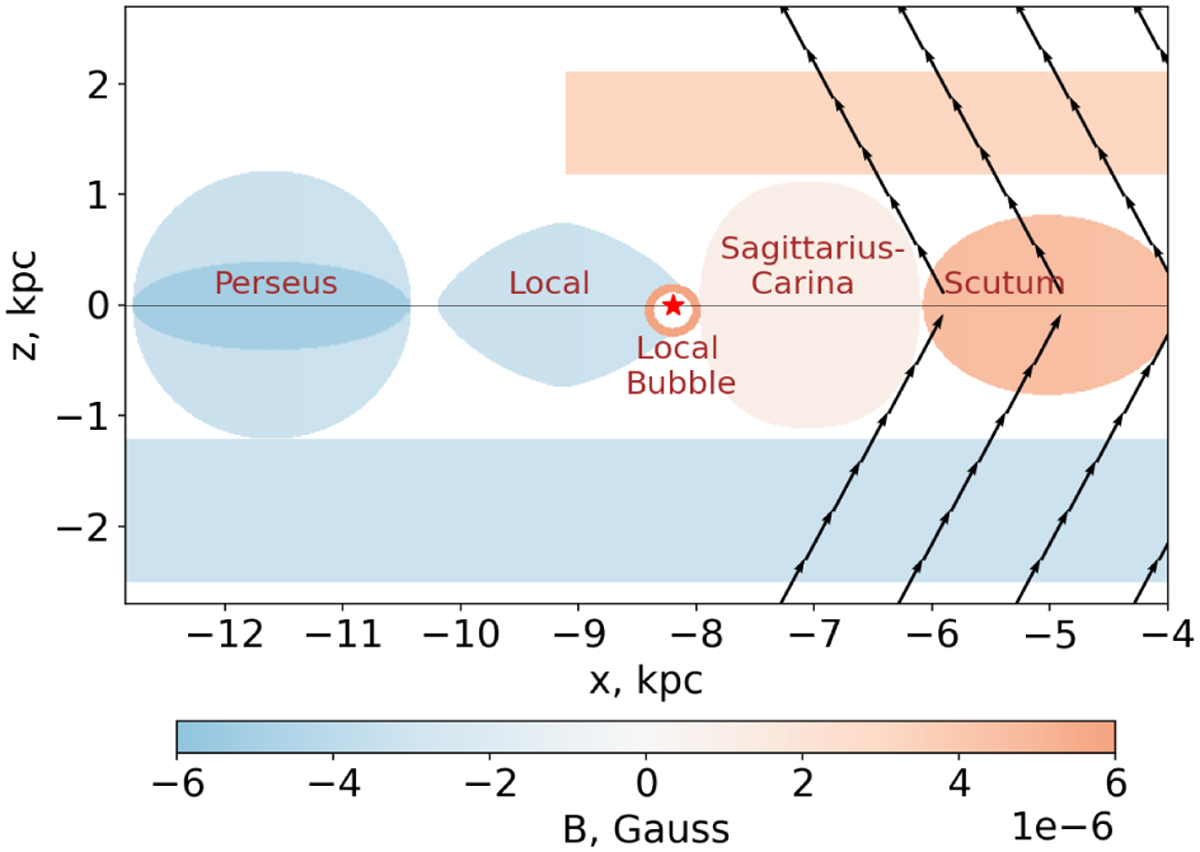
Section of the best-fit GMF model in the plane y = 0, which is perpendicular to the Galactic plane and passes through the Sun (red star) and Galactic centre. Blue and orange regions are the magnetic arms, northern and southern toroidal field and the Local Bubble. The color map is the same as in Fig. 3. Black arrows show the direction of the X-shaped field. Red star marks the position of the Sun.
Current usage metrics show cumulative count of Article Views (full-text article views including HTML views, PDF and ePub downloads, according to the available data) and Abstracts Views on Vision4Press platform.
Data correspond to usage on the plateform after 2015. The current usage metrics is available 48-96 hours after online publication and is updated daily on week days.
Initial download of the metrics may take a while.