Open Access
Fig. A.1.
Download original image
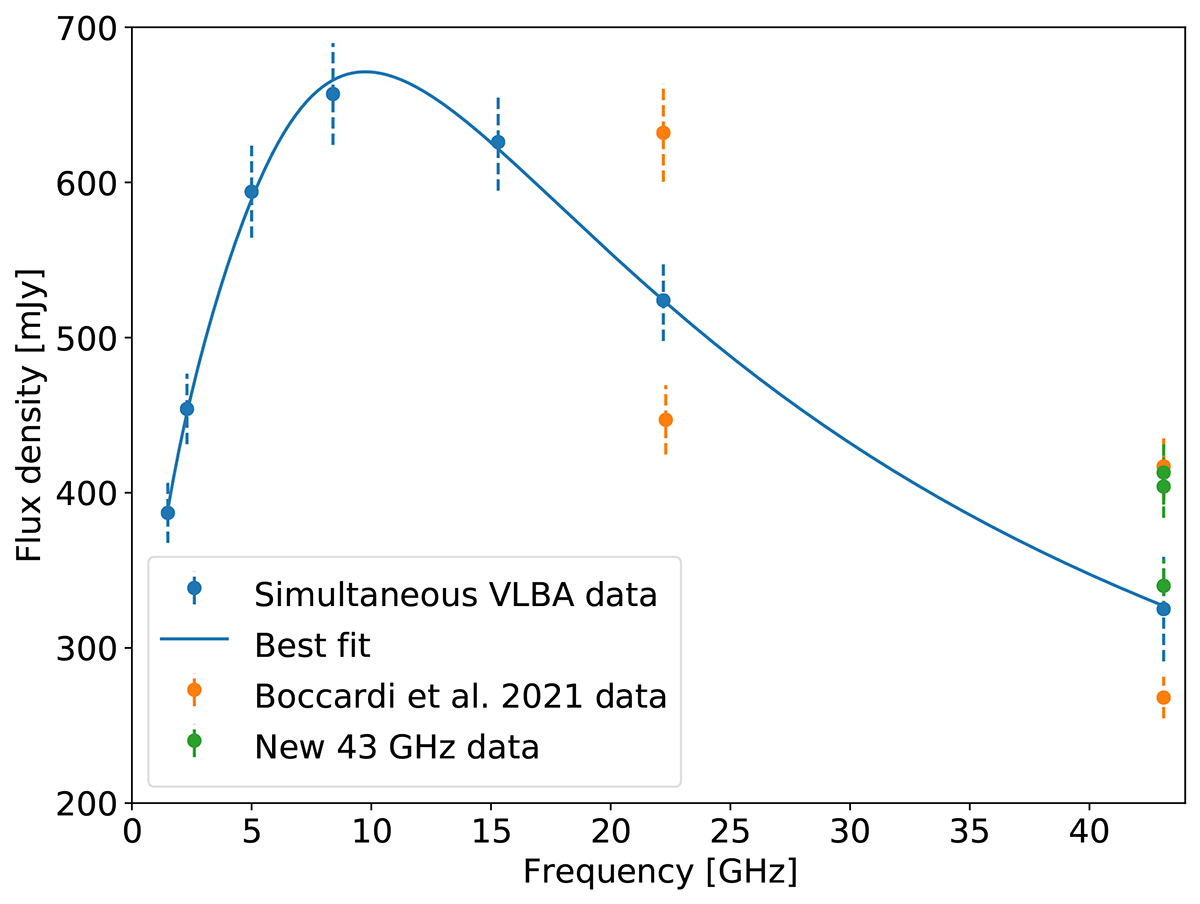
Flux density as a function of frequency. The blue data points are from the re-analyzed multi-frequency VLBA data set, the orange points are from the 22 GHz and 43 GHz observations published in Boccardi et al. (2021), and the green points are from the new 43 GHz observations presented in Sect. 2.1.
Current usage metrics show cumulative count of Article Views (full-text article views including HTML views, PDF and ePub downloads, according to the available data) and Abstracts Views on Vision4Press platform.
Data correspond to usage on the plateform after 2015. The current usage metrics is available 48-96 hours after online publication and is updated daily on week days.
Initial download of the metrics may take a while.