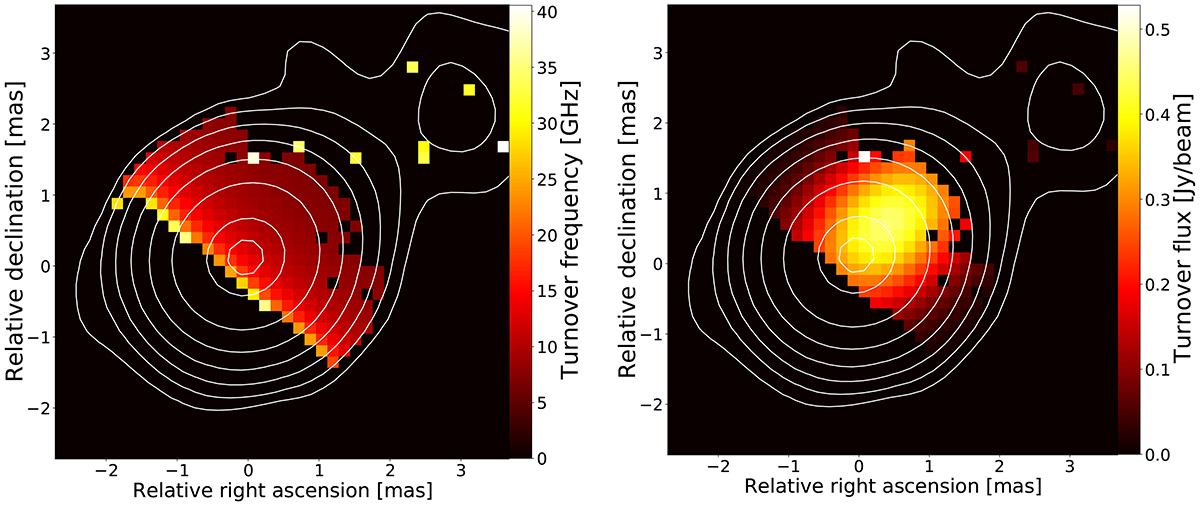
Fig. 7.
Download original image
Results from the turnover frequency analysis. Left panel: turnover frequency for each pixel obtained by fitting the synchrotron spectrum across five frequencies between 5 and 43 GHz. The constant turnover values in the direction perpendicular to the jet propagation point out that the transversal structure is not resolved. The turnover frequency is clearly seen to decrease as going further from the core. The black pixels are spurious data points arising from a not successful fitting of the data. Right panel: brightness at the respective turnover frequency. In both maps, the contours are from the 43 GHz map.
Current usage metrics show cumulative count of Article Views (full-text article views including HTML views, PDF and ePub downloads, according to the available data) and Abstracts Views on Vision4Press platform.
Data correspond to usage on the plateform after 2015. The current usage metrics is available 48-96 hours after online publication and is updated daily on week days.
Initial download of the metrics may take a while.