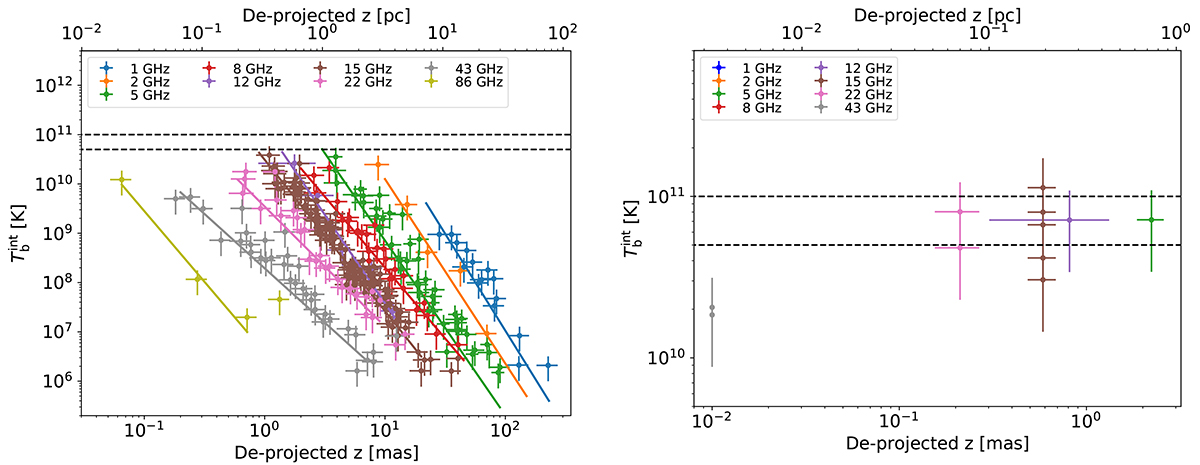
Fig. 6.
Download original image
Intrinsic brightness temperature profiles of the Gaussian component at different frequencies. The horizontal dashed lines represent the median equipartition brightness temperature derived from sample studies, Tb = 5 × 10¹⁰ K, and the upper limit Tb = 1011 K. Left panel: brightness temperature values for the jet components. The continuous lines are the best-fit power laws at different frequencies. Right panel: brightness temperature values for the core components.
Current usage metrics show cumulative count of Article Views (full-text article views including HTML views, PDF and ePub downloads, according to the available data) and Abstracts Views on Vision4Press platform.
Data correspond to usage on the plateform after 2015. The current usage metrics is available 48-96 hours after online publication and is updated daily on week days.
Initial download of the metrics may take a while.