Fig. 2.
Download original image
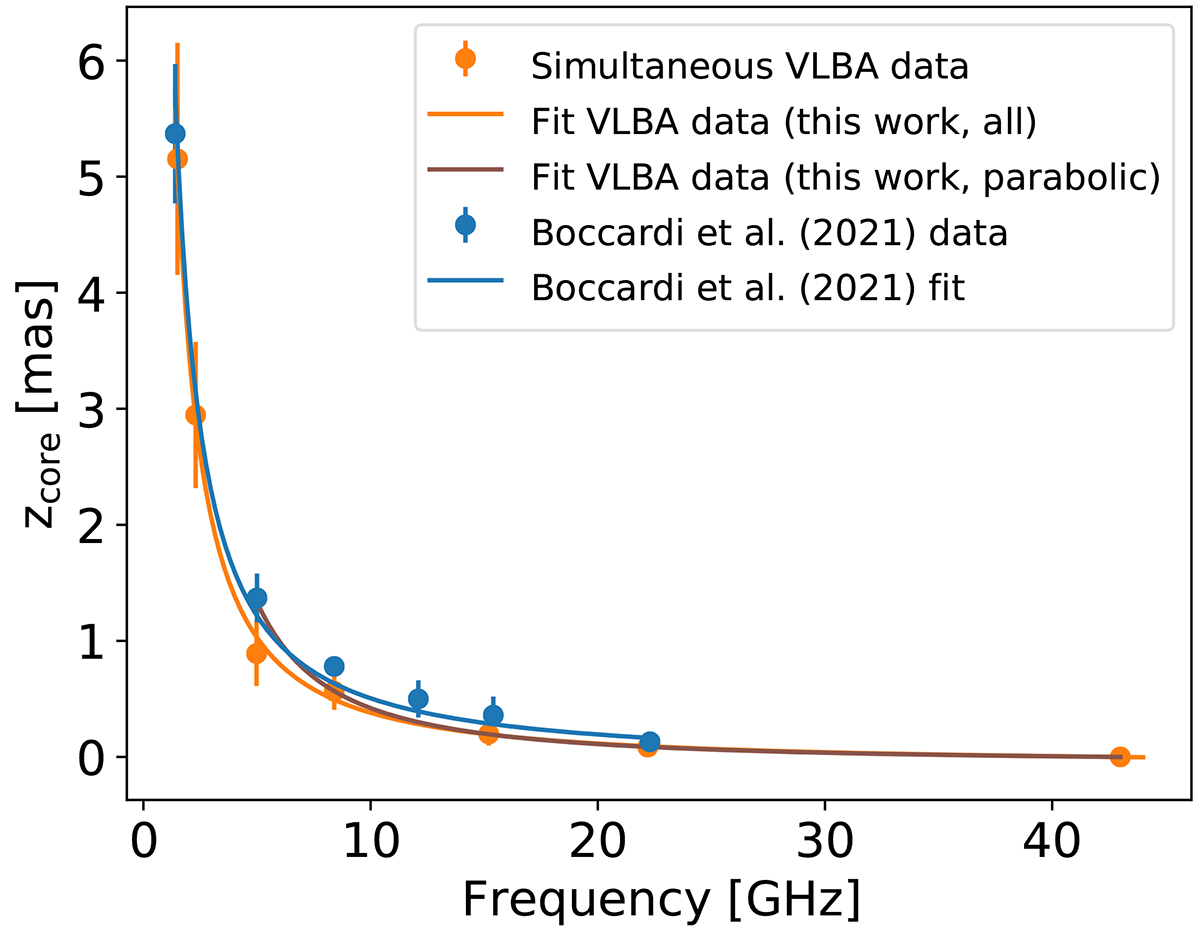
Core position as a function of frequency for the two different data sets: i) the multi-frequency VLBA data set (orange points) and ii) the multi-frequency and multi-epoch data set presented in Boccardi et al. (2021) (blue points). The blue line represents the best-fit values presented in Boccardi et al. (2021), the orange line traces the best-fit performed in this paper by employing all the data, and the purple line highlights the best-fit curve obtained using only the data points at 8, 15, 22, and 43 GHz.
Current usage metrics show cumulative count of Article Views (full-text article views including HTML views, PDF and ePub downloads, according to the available data) and Abstracts Views on Vision4Press platform.
Data correspond to usage on the plateform after 2015. The current usage metrics is available 48-96 hours after online publication and is updated daily on week days.
Initial download of the metrics may take a while.