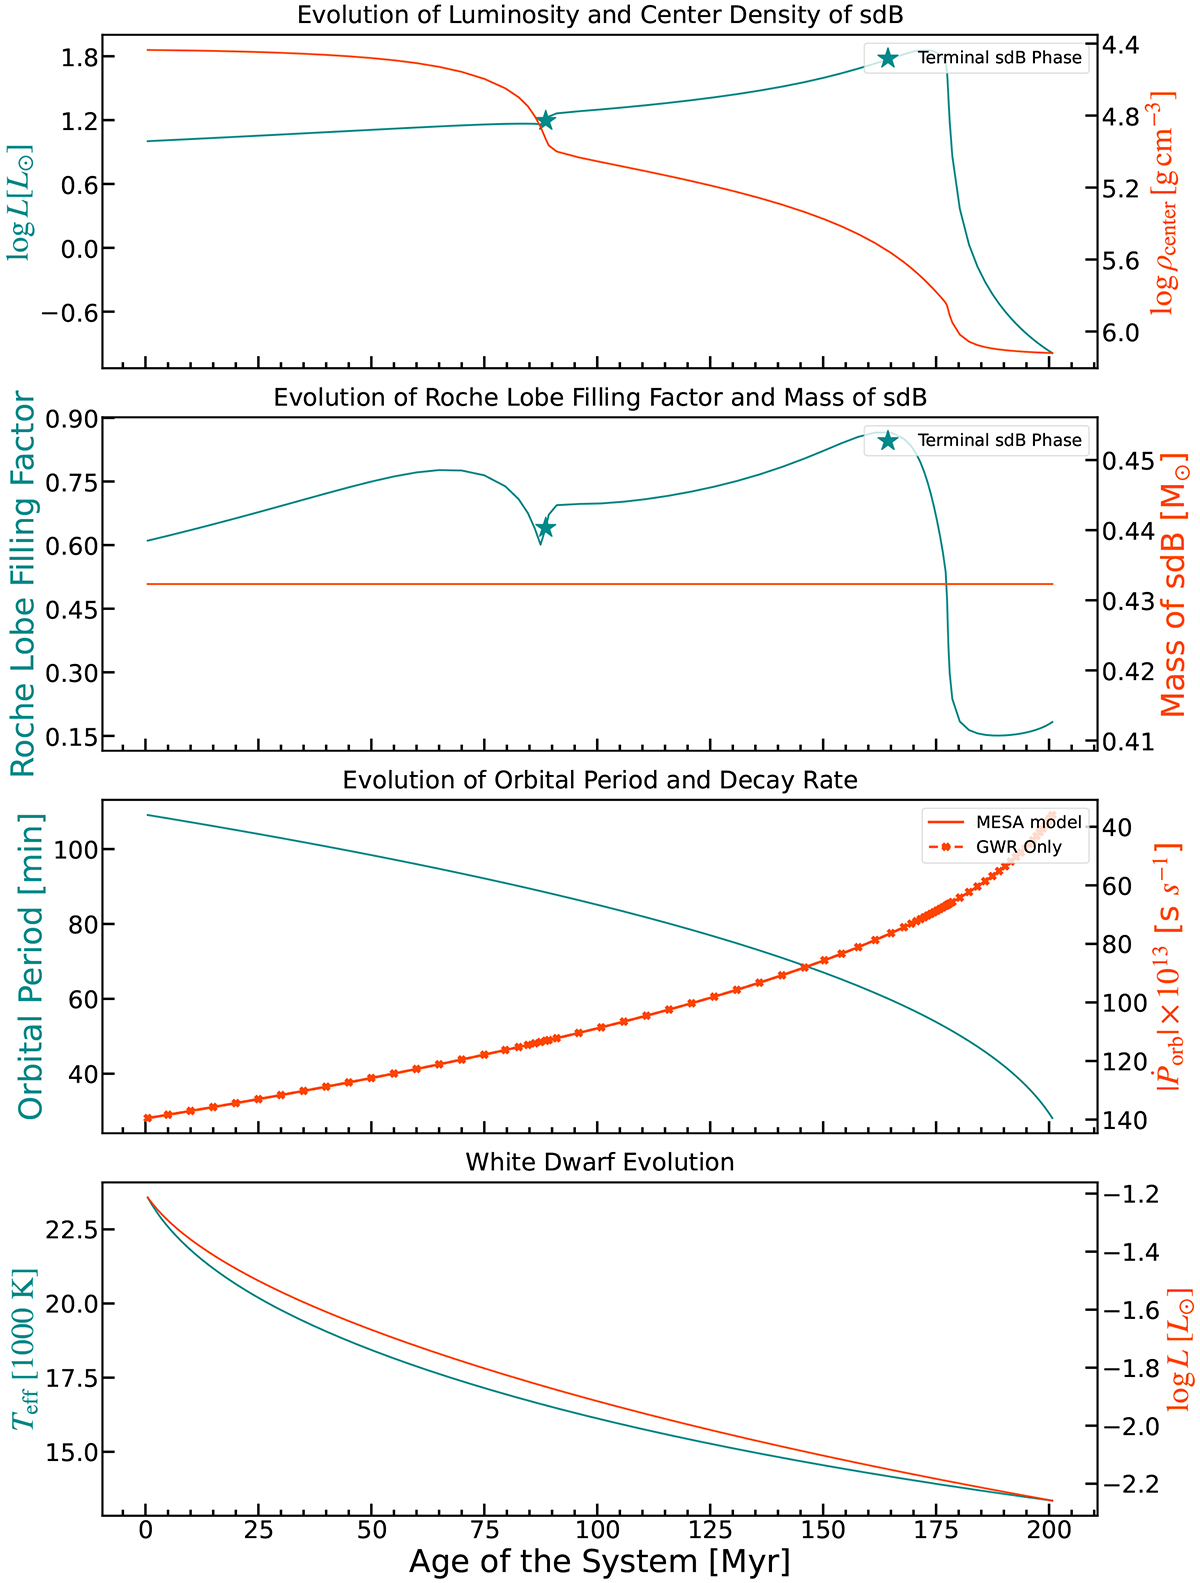
Fig. 8.
Download original image
Binary evolution of J1710 from the present day until the sdB star evolves into a WD, modeled using the MESA code. In the top two panels, the moment when the sdB phase ends is marked with a star. In each subplot, the green lines correspond to the left vertical axis, and the red lines correspond to the right vertical axis. Detailed descriptions of the panels are provided in Sect. 4.2.
Current usage metrics show cumulative count of Article Views (full-text article views including HTML views, PDF and ePub downloads, according to the available data) and Abstracts Views on Vision4Press platform.
Data correspond to usage on the plateform after 2015. The current usage metrics is available 48-96 hours after online publication and is updated daily on week days.
Initial download of the metrics may take a while.