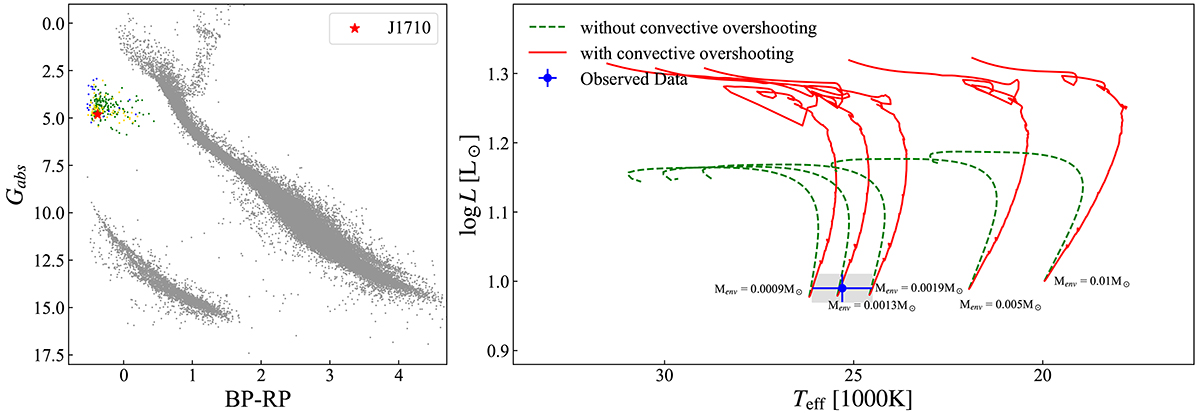
Fig. 7.
Download original image
Color-magnitude diagram and evolutionary tracks for five sdB models derived from a 2.16 M⊙ main-sequence progenitor. In the left panel, the gray data points represent sources within 100 parsecs in the Gaia DR3 dataset, and the green, blue, and gold points indicate candidate sources identified as sdB, sdO, and sdOB stars, respectively. The right panel shows MESA evolutionary tracks of sdB model stars with different hydrogen envelope masses, with or without convective overshooting. When the helium core mass is 0.431 M⊙ and the envelope mass is 0.0013 M⊙, the evolutionary track covers the observed data and corresponding 1σ error region.
Current usage metrics show cumulative count of Article Views (full-text article views including HTML views, PDF and ePub downloads, according to the available data) and Abstracts Views on Vision4Press platform.
Data correspond to usage on the plateform after 2015. The current usage metrics is available 48-96 hours after online publication and is updated daily on week days.
Initial download of the metrics may take a while.