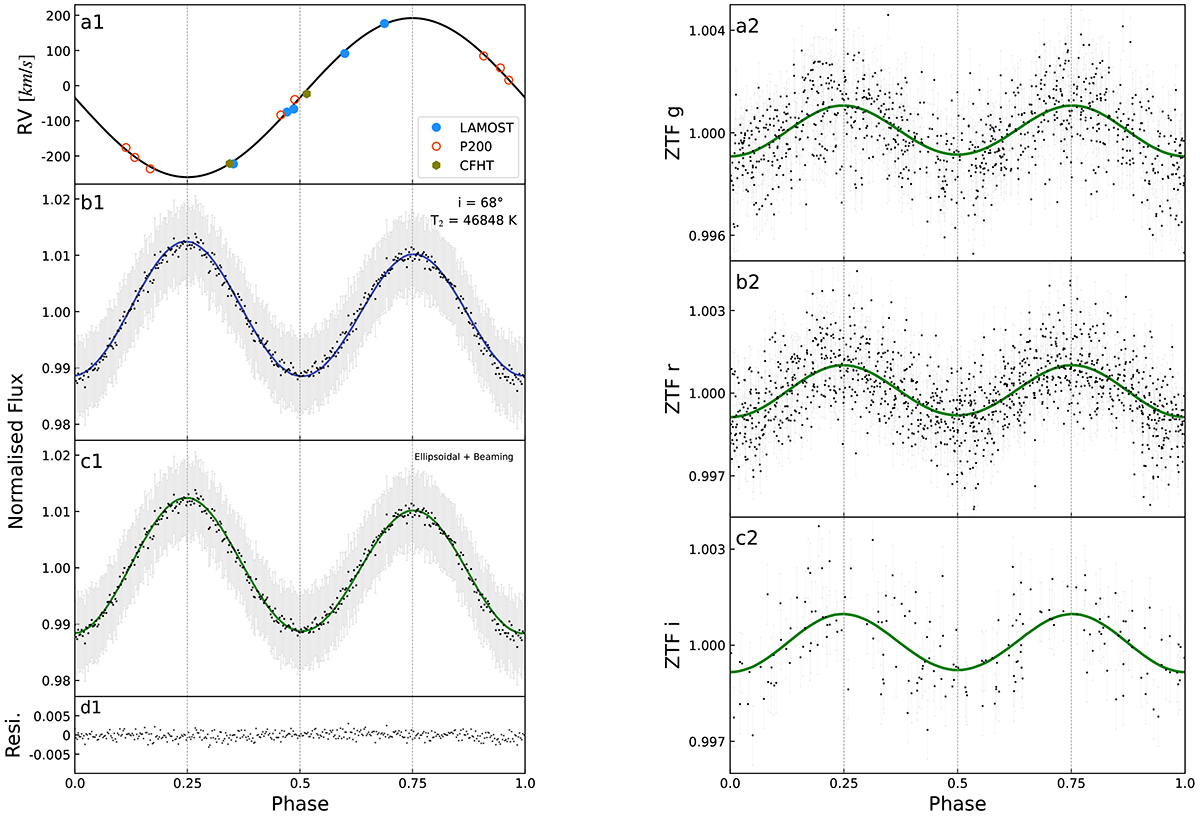
Fig. 5.
Download original image
Folded RV curve, normalized light curves, and model light curves in the ZTF g, r, and i bands and in the TESS band. The photometric data points are represented as black points in all folded light curves. The gray shading indicates the errors. The model light curves generated from the Wilson-Devinney code are depicted in green for their respective bands. Panel a1 illustrates the calculated RV curve using the best-fit values K1 = 222.2 km/s and Vsys = −36.5 km/s. Detailed spectroscopic information is provided in Table 1. Panel b1 displays the fitting results when the inclination is highest and the companion star temperature is highest. The model light curve is shown in blue. No significant features of the companion star are discernible. Panel c1 presents the TESS light curve and the well-fit model light curve. The companion star temperature is fixed at 20 000K and the other parameters are set to their mean values, as described in the main text. The residuals are depicted in panel d1. Panels a2, b2, and c2 show the ZTF light curves and the corresponding model light curves.
Current usage metrics show cumulative count of Article Views (full-text article views including HTML views, PDF and ePub downloads, according to the available data) and Abstracts Views on Vision4Press platform.
Data correspond to usage on the plateform after 2015. The current usage metrics is available 48-96 hours after online publication and is updated daily on week days.
Initial download of the metrics may take a while.