Fig. 3.
Download original image
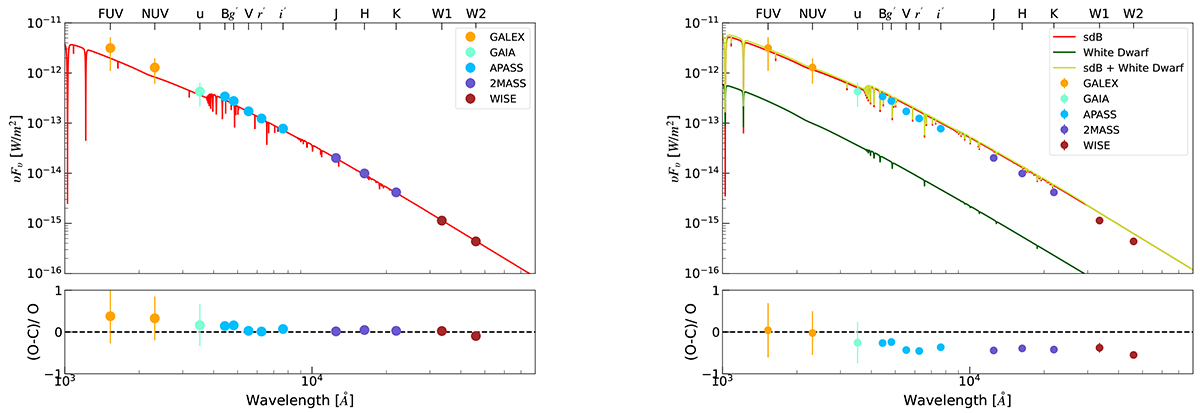
SED fit of J1710. The left panel displays the broad SED and observed photometry for the single sdB component (red), and the right panel includes an additional WD component (green). However, aligning the Galaxy Evolution Explorer (GALEX) photometry values in the right panel results in a deviation of the total flux (yellow) from the observed photometry in other bands. The photometric data sources include GALEX (Lasker et al. 2008), Gaia (synthetic photometry derived from Gaia BP/RP mean spectra in the Sloan Digital Sky Survey (SDSS) u-band, aquamarine; Gaia Collaboration 2022), the AAVSO Photometric All-Sky Survey (APASS) (Henden et al. 2015), the Two Micron All-Sky Survey (2MASS) (Cutri et al. 2003), and the Wide-field Infrared Survey Explorer (WISE) (W1 and W2, brown; Cutri et al. 2021). The Pan-STARRS (PS1) observations of J1710 in the g, r, i, z, and y bands (12.67, 13.04, 13.31, 13.35, and 13.62 mag) obtained through the VizieR Photometry Viewer exceeded the limiting magnitudes for bright stars in these bands, as indicated in Table 11 of Chambers et al. (2016), except for the y band. Therefore, APASS photometric data were used instead of PS1 data.
Current usage metrics show cumulative count of Article Views (full-text article views including HTML views, PDF and ePub downloads, according to the available data) and Abstracts Views on Vision4Press platform.
Data correspond to usage on the plateform after 2015. The current usage metrics is available 48-96 hours after online publication and is updated daily on week days.
Initial download of the metrics may take a while.