Fig. 8
Download original image
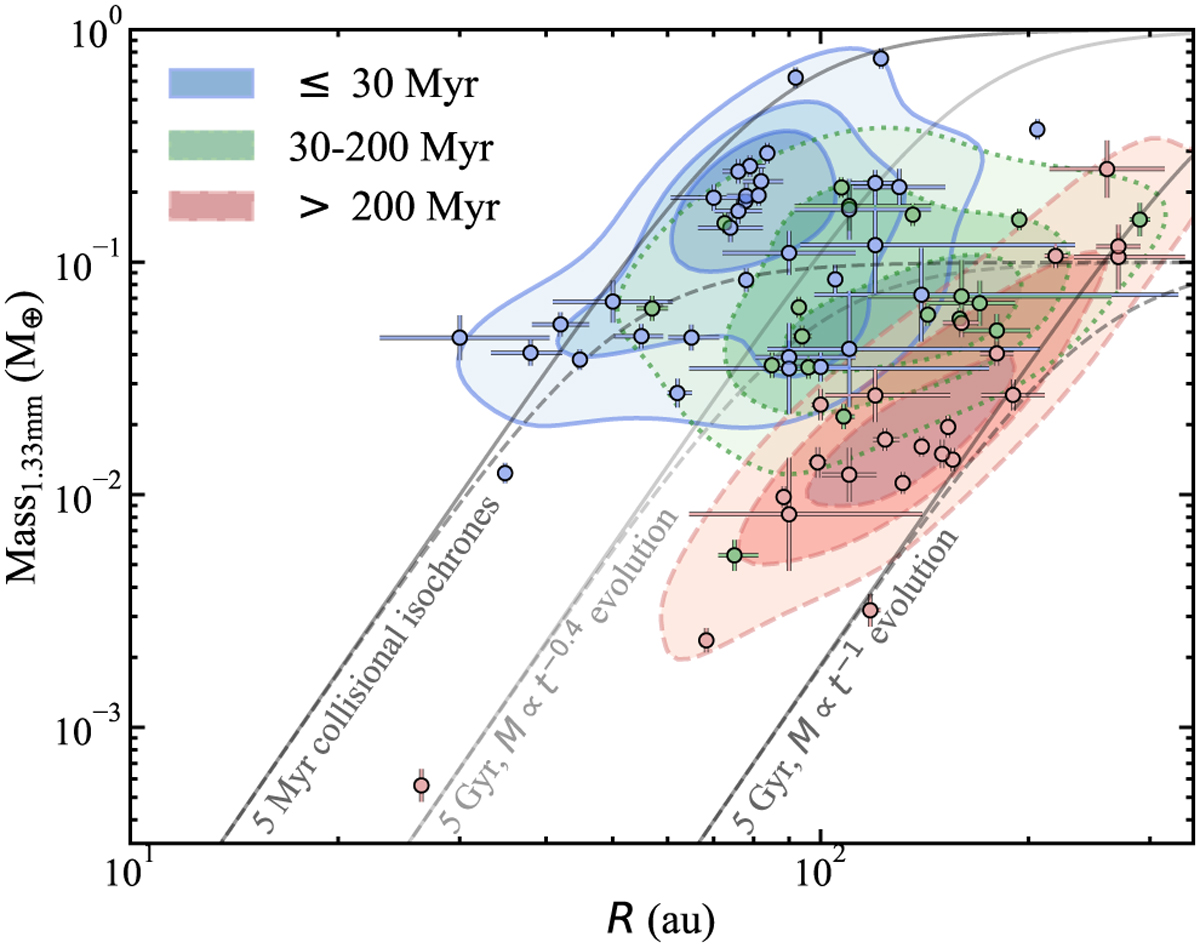
Belt dust mass (as measured at 1.33 mm) as a function of resolved belt radius for the REASONS sample (coloured points with error bars). The filled contours represent the 2D density distributions of belts ≤ 30 (blue solid), 30–200 (green dotted), and >200 (red dashed) Myr-old. Contour lines are defined to contain 20, 50, and 80% of the population for each age range. Black lines represent predictions from a simple collisional evolution model as described in Sect. 5.3, for collisional ages of 5 Myr (left) and 5 Gyr (right), an initial dust mass of 1 M⊕ (solid) or 0.1 M⊕ (dashed), and dust masses evolving with time as t−0.4 or t−1 between 5 Myr and 5 Gyr.
Current usage metrics show cumulative count of Article Views (full-text article views including HTML views, PDF and ePub downloads, according to the available data) and Abstracts Views on Vision4Press platform.
Data correspond to usage on the plateform after 2015. The current usage metrics is available 48-96 hours after online publication and is updated daily on week days.
Initial download of the metrics may take a while.