Fig. 7
Download original image
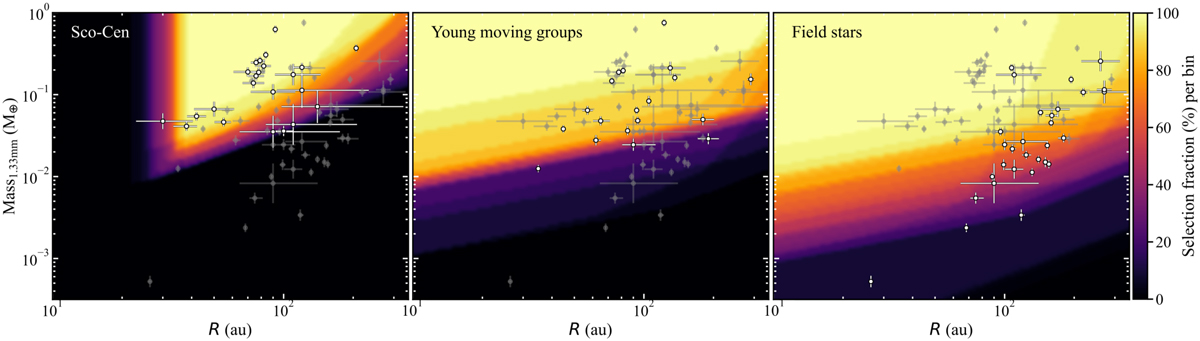
Mass of grains as measured from belt flux densities at 1.33 mm as a function of the radius of observed planetesimal belts (all points with error bars). Each panel focuses on a different subgroup of REASONS belts (shown as the white points, rest of the population in grey), those orbiting stars in the Sco-Cen association (left), young moving groups (middle) and field stars (right). In all panels, the background colour map represents the selection probability (%), or percentage of belts in that subgroup that would pass the selection effects at a given [Mass1.33mm-R] location, assuming unobserved belts have the same distribution of parameters [d,RBB/R, L⋆, λ0, β] as the observed population. The changing colour maps in each panel show how selection biases vary depending on stellar properties and observing strategies employed for different subgroups.
Current usage metrics show cumulative count of Article Views (full-text article views including HTML views, PDF and ePub downloads, according to the available data) and Abstracts Views on Vision4Press platform.
Data correspond to usage on the plateform after 2015. The current usage metrics is available 48-96 hours after online publication and is updated daily on week days.
Initial download of the metrics may take a while.