Fig. 4
Download original image
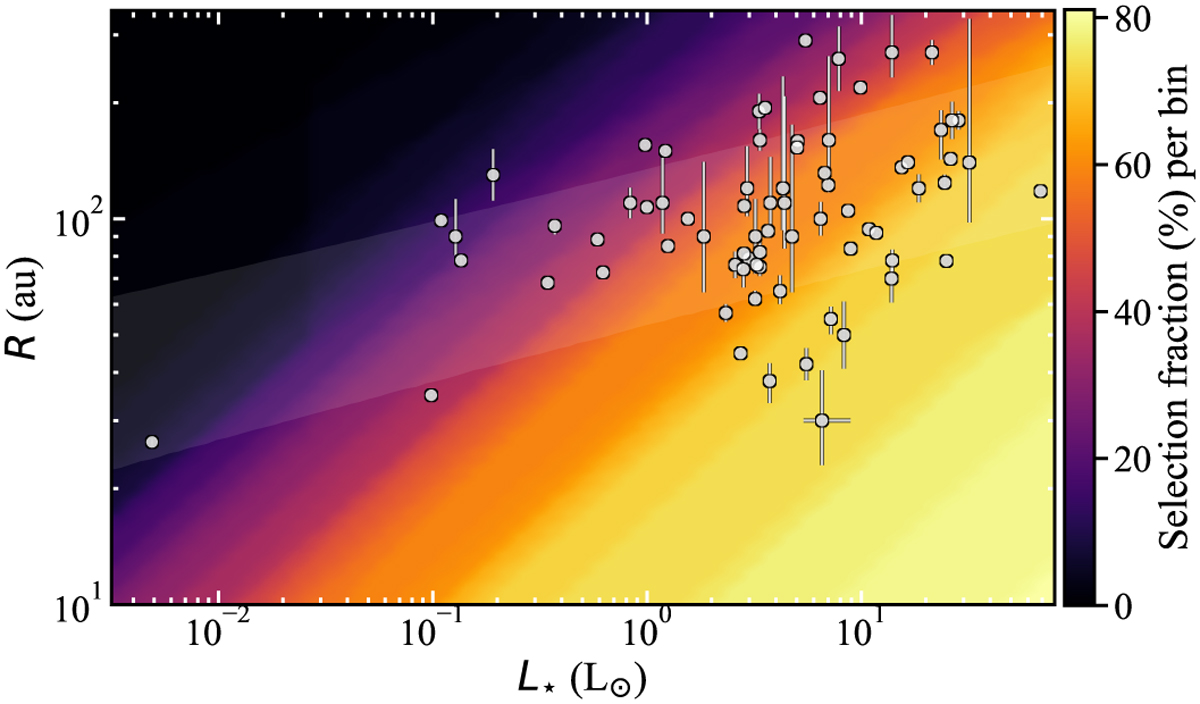
Radius of observed planetesimal belts as a function of host star luminosity (black and white points with error bars). The white shaded region represents the ±1σ range of power laws (about the best fit) allowed by the data, including the intrinsic scatter as well as the uncertainty in the observed radii. The background colour map represents the selection probability (%), or percentage of belts that would pass the selection effects at a given [R-L⋆] location, assuming unobserved belts have the same distribution of parameters [d,RBB/R, M, λ0 , β] as the observed population.
Current usage metrics show cumulative count of Article Views (full-text article views including HTML views, PDF and ePub downloads, according to the available data) and Abstracts Views on Vision4Press platform.
Data correspond to usage on the plateform after 2015. The current usage metrics is available 48-96 hours after online publication and is updated daily on week days.
Initial download of the metrics may take a while.