Fig. 2
Download original image
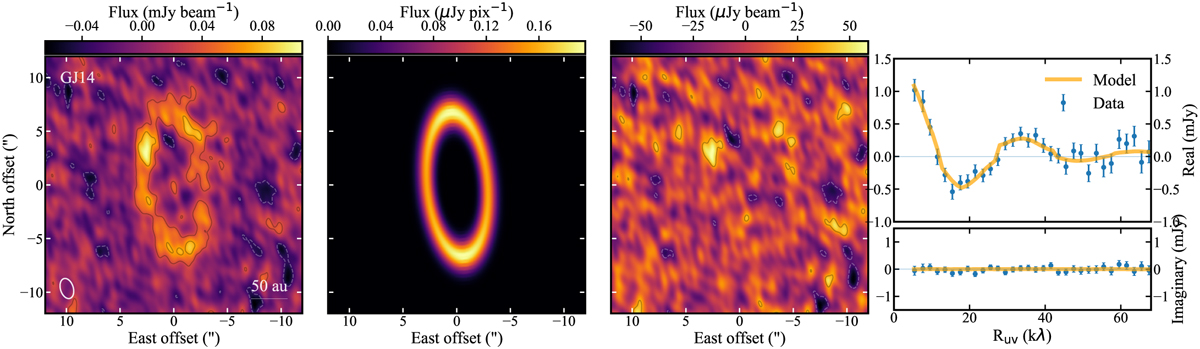
Visuals used to support the modelling and fit evaluation process, carried out for each system, here shown for the GJ14 system as an example. Leftmost: ALMA continuum image of the GJ14 system (see imaging details in tables available on ZENODO). Contours are [2,4,..] × the RMS noise level. Center left: full resolution best-fit belt model. Center right: residual image after subtraction of the best-fit visibilities from the data. Imaging parameters and contours are the same as the leftmost image. Rightmost: real and imaginary part of the azimuthally averaged de-projected complex visibility profiles, for both the data (blue points with uncertainties) and the best-fit model (orange lines). The de-projection was carried out using the best-fit inclination and PA from Table 1.
Current usage metrics show cumulative count of Article Views (full-text article views including HTML views, PDF and ePub downloads, according to the available data) and Abstracts Views on Vision4Press platform.
Data correspond to usage on the plateform after 2015. The current usage metrics is available 48-96 hours after online publication and is updated daily on week days.
Initial download of the metrics may take a while.