Fig. B.6
Download original image
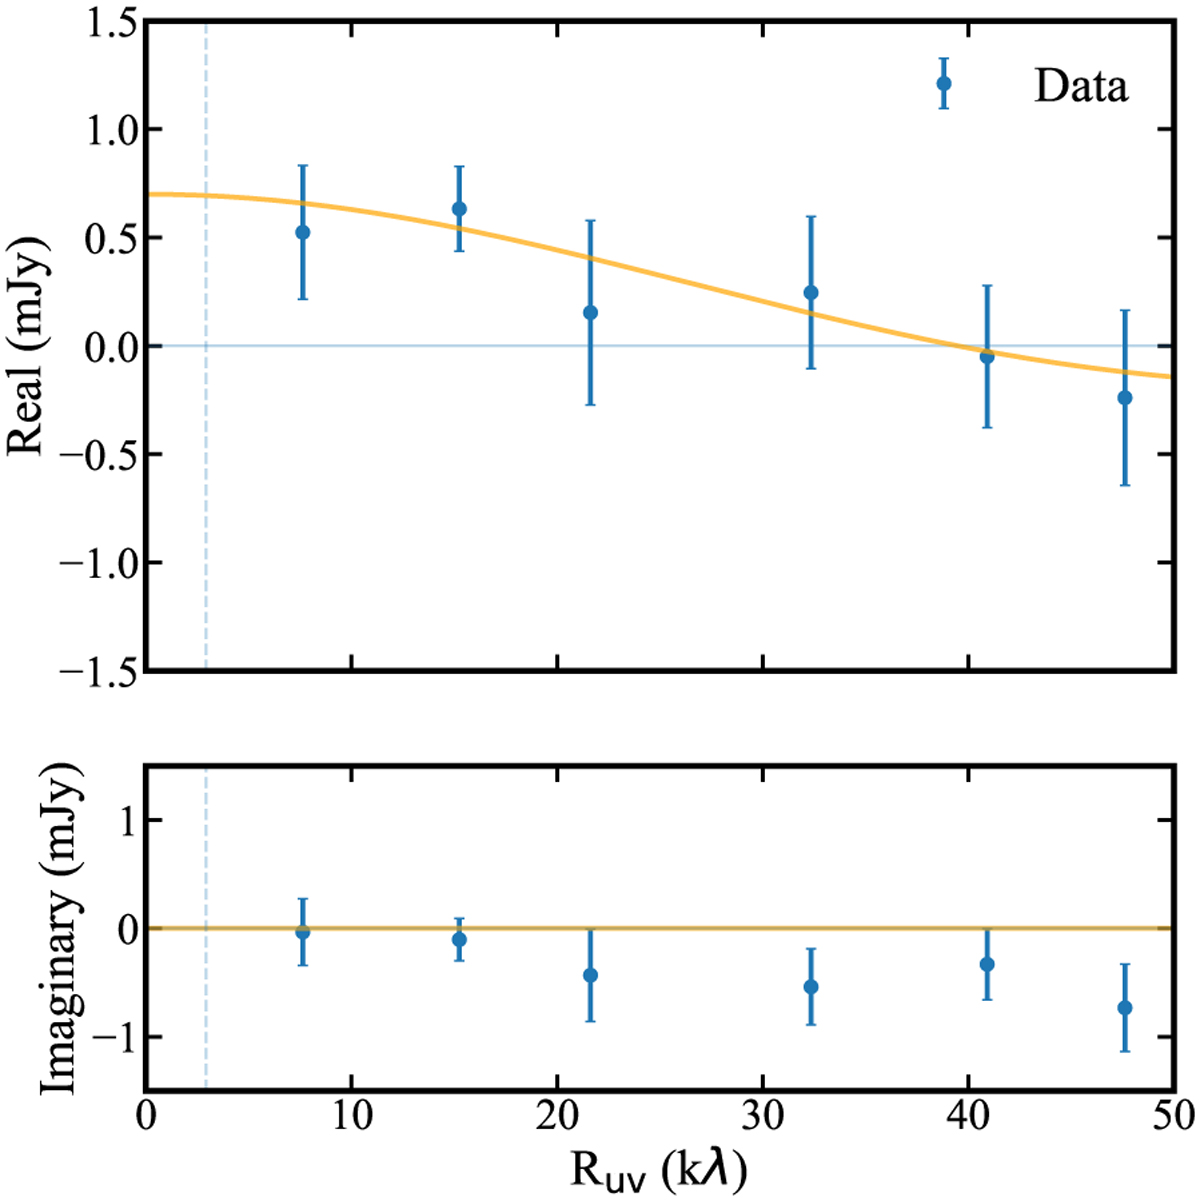
u-v radial profile of measured SMA complex-valued visibility function (blue error bars), at the phase center of the observations (corresponding to the location of star HD213617), after subtraction of the offset sources SMA 223237.17+201352.3 and SMA 223235.16+201347.6. In orange is a model of a face-on belt with a Gaussian radial surface density distribution, with 2.0″ radius, 0.5″ width, and 0.7 mJy total flux density, showing that the faint, marginal emission seen in Fig. B.1 at the phase center could plausibly originate from a belt around HD213617.
Current usage metrics show cumulative count of Article Views (full-text article views including HTML views, PDF and ePub downloads, according to the available data) and Abstracts Views on Vision4Press platform.
Data correspond to usage on the plateform after 2015. The current usage metrics is available 48-96 hours after online publication and is updated daily on week days.
Initial download of the metrics may take a while.