Fig. B.1
Download original image
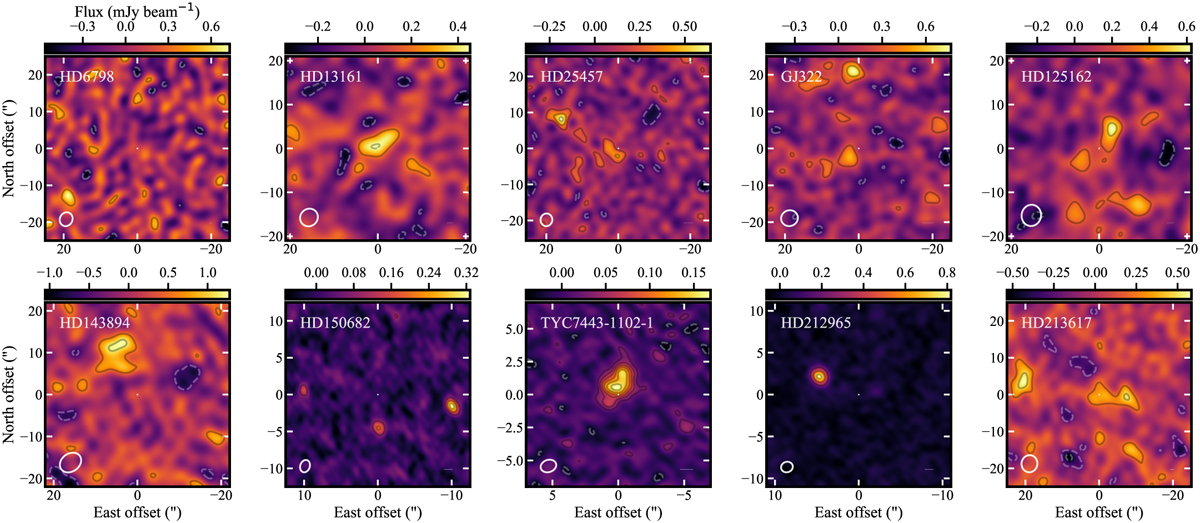
Millimetre continuum images for the 10 systems in the REASONS observing programme where a belt was not detected or significantly resolved, ordered by source RA. North is up, East is left. Bars indicate a physical scale of 50 au, and ellipses represent the synthesized beam of the observations. Images were obtained with the CLEAN algorithm as described in Sect. 3, with weighting parameters, resulting RMS noise levels and beams listed in the tables available on ZENODO (see Data availability section). All images are in a linear colour scale, stretching from 0 (black) to the maximum intensity of the image. Contours are set at [−4, −2, 2, 4, ..] times the RMS noise level of each image.
Current usage metrics show cumulative count of Article Views (full-text article views including HTML views, PDF and ePub downloads, according to the available data) and Abstracts Views on Vision4Press platform.
Data correspond to usage on the plateform after 2015. The current usage metrics is available 48-96 hours after online publication and is updated daily on week days.
Initial download of the metrics may take a while.