Fig. 3.
Download original image
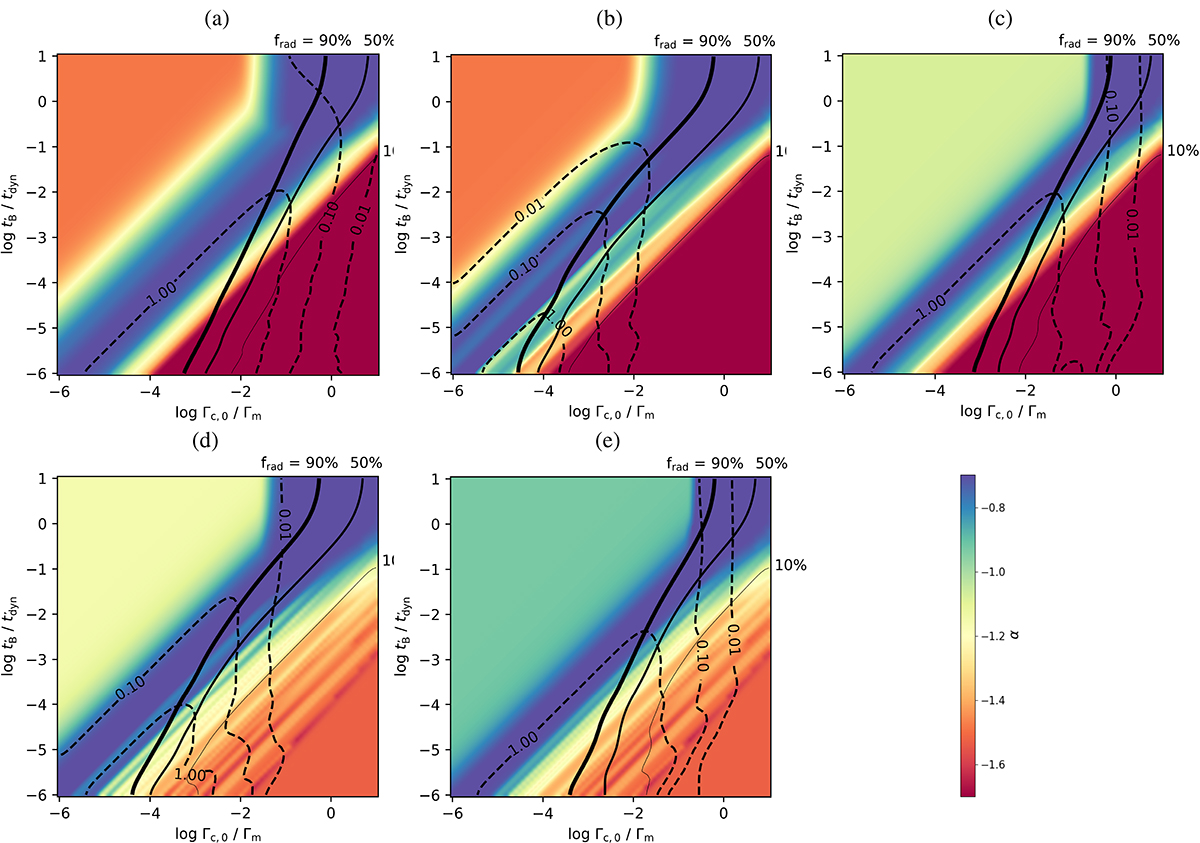
Synchrotron emission within a decaying magnetic field: Parameter space. In the ![]() vs Γc, 0/Γm plane, the value of the low-energy photon index α of the synchrotron spectrum is colour-coded. In this plane, the standard synchrotron spectrum with a constant magnetic field is at the top (
vs Γc, 0/Γm plane, the value of the low-energy photon index α of the synchrotron spectrum is colour-coded. In this plane, the standard synchrotron spectrum with a constant magnetic field is at the top (![]() ). In this case the fast cooling regime is on the left (Γc, 0 ≪ Γm), while the marginally fast cooling regime is on the right (Γc, 0 ≃ Γm). Black solid lines indicate the limits of the high radiative efficiency region (thick: frad = 0.9; thin: frad = 0.5; very thin: fdad = 0.1). Contours of the inverse Compton/synchrotron ratio Lic/Lsyn are plotted with black dashed lines. Each panel corresponds to a set of values for the parameters YTh, 0 and wm that govern the importance of inverse Compton scatterings and Klein-Nishina corrections. (a) YTh, 0 = 0.1; wm = 10−2. (b) YTh, 0 = 0.1; wm = 102. (c) YTh, 0 = 102; wm = 102. (d) YTh, 0 = 102; wm = 104. (e) YTh, 0 = 104; wm = 104.
). In this case the fast cooling regime is on the left (Γc, 0 ≪ Γm), while the marginally fast cooling regime is on the right (Γc, 0 ≃ Γm). Black solid lines indicate the limits of the high radiative efficiency region (thick: frad = 0.9; thin: frad = 0.5; very thin: fdad = 0.1). Contours of the inverse Compton/synchrotron ratio Lic/Lsyn are plotted with black dashed lines. Each panel corresponds to a set of values for the parameters YTh, 0 and wm that govern the importance of inverse Compton scatterings and Klein-Nishina corrections. (a) YTh, 0 = 0.1; wm = 10−2. (b) YTh, 0 = 0.1; wm = 102. (c) YTh, 0 = 102; wm = 102. (d) YTh, 0 = 102; wm = 104. (e) YTh, 0 = 104; wm = 104.
Current usage metrics show cumulative count of Article Views (full-text article views including HTML views, PDF and ePub downloads, according to the available data) and Abstracts Views on Vision4Press platform.
Data correspond to usage on the plateform after 2015. The current usage metrics is available 48-96 hours after online publication and is updated daily on week days.
Initial download of the metrics may take a while.