Fig. 10.
Download original image
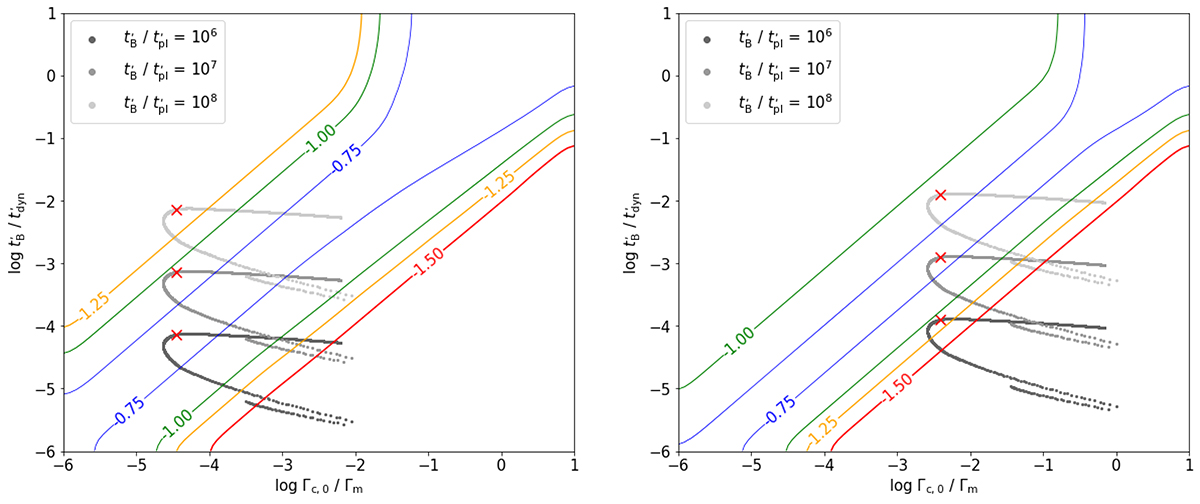
Evolution of ![]() and Γc, 0/Γm during the pulse duration. Left: Evolution for case A. The contour lines for values of α = −1.5, −1.25, −1, −0.75 are shown, using the simulations obtained for YTh, 0 = 0.1; wm = 102 (adopted from the upper right plot of Fig. 3). Right: Evolution for case B. The same contour lines are shown for α, using the simulations obtained for YTh, 0 = 102; wm = 102 (adopted from the middle-left plot of Fig. 3). We have overplotted (in grey lines) the values of
and Γc, 0/Γm during the pulse duration. Left: Evolution for case A. The contour lines for values of α = −1.5, −1.25, −1, −0.75 are shown, using the simulations obtained for YTh, 0 = 0.1; wm = 102 (adopted from the upper right plot of Fig. 3). Right: Evolution for case B. The same contour lines are shown for α, using the simulations obtained for YTh, 0 = 102; wm = 102 (adopted from the middle-left plot of Fig. 3). We have overplotted (in grey lines) the values of ![]() calculated using the parameters of the dynamical evolution (Γm and density in the co-moving frame) for case (A) and case (B) and assuming a constant ratio
calculated using the parameters of the dynamical evolution (Γm and density in the co-moving frame) for case (A) and case (B) and assuming a constant ratio ![]() , 107, or 108. Red crosses show values at the maximum of the pulse, that is, where the dissipated energy per unit mass obtains maximum.
, 107, or 108. Red crosses show values at the maximum of the pulse, that is, where the dissipated energy per unit mass obtains maximum.
Current usage metrics show cumulative count of Article Views (full-text article views including HTML views, PDF and ePub downloads, according to the available data) and Abstracts Views on Vision4Press platform.
Data correspond to usage on the plateform after 2015. The current usage metrics is available 48-96 hours after online publication and is updated daily on week days.
Initial download of the metrics may take a while.