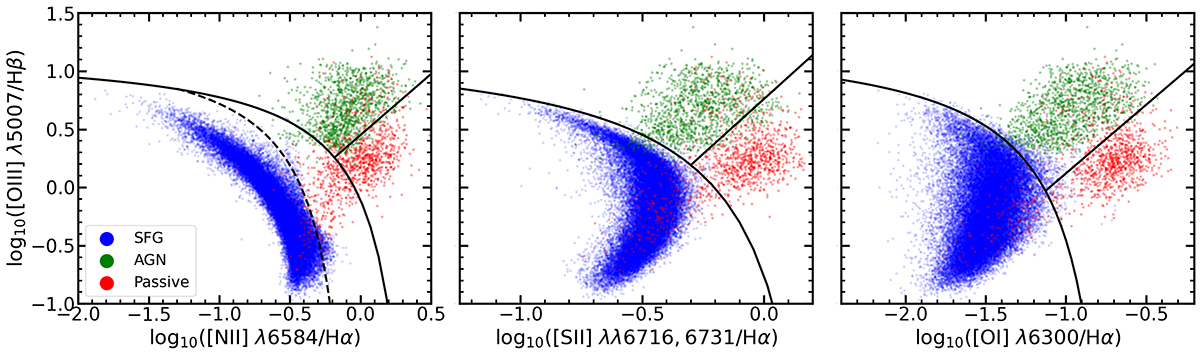
Fig. 2.
Download original image
Projections of the training sample for the three principal galaxy activity classes. The left plot shows the standard BPT diagram, the middle plot displays log10([O III]/Hβ) vs. log10([S II]/Hα), and the right plot illustrates log10([O III]/Hβ) vs. log10([O I]/Hα). The blue dots represent SF galaxies, the green dots represent AGN galaxies, and the red dots represent passive galaxies. We note that in all three plots, only a subset of the passive galaxies is presented due to the typically poor quality of their spectra. For these plots, we selected galaxies with emission lines having S/N > 3. In all three plots, the black dashed line corresponds to Kauffmann et al. (2003), the black solid curved line represents Kewley et al. (2001), and the straight black line is Schawinski et al. (2007), which separates LINERs from AGN.
Current usage metrics show cumulative count of Article Views (full-text article views including HTML views, PDF and ePub downloads, according to the available data) and Abstracts Views on Vision4Press platform.
Data correspond to usage on the plateform after 2015. The current usage metrics is available 48-96 hours after online publication and is updated daily on week days.
Initial download of the metrics may take a while.