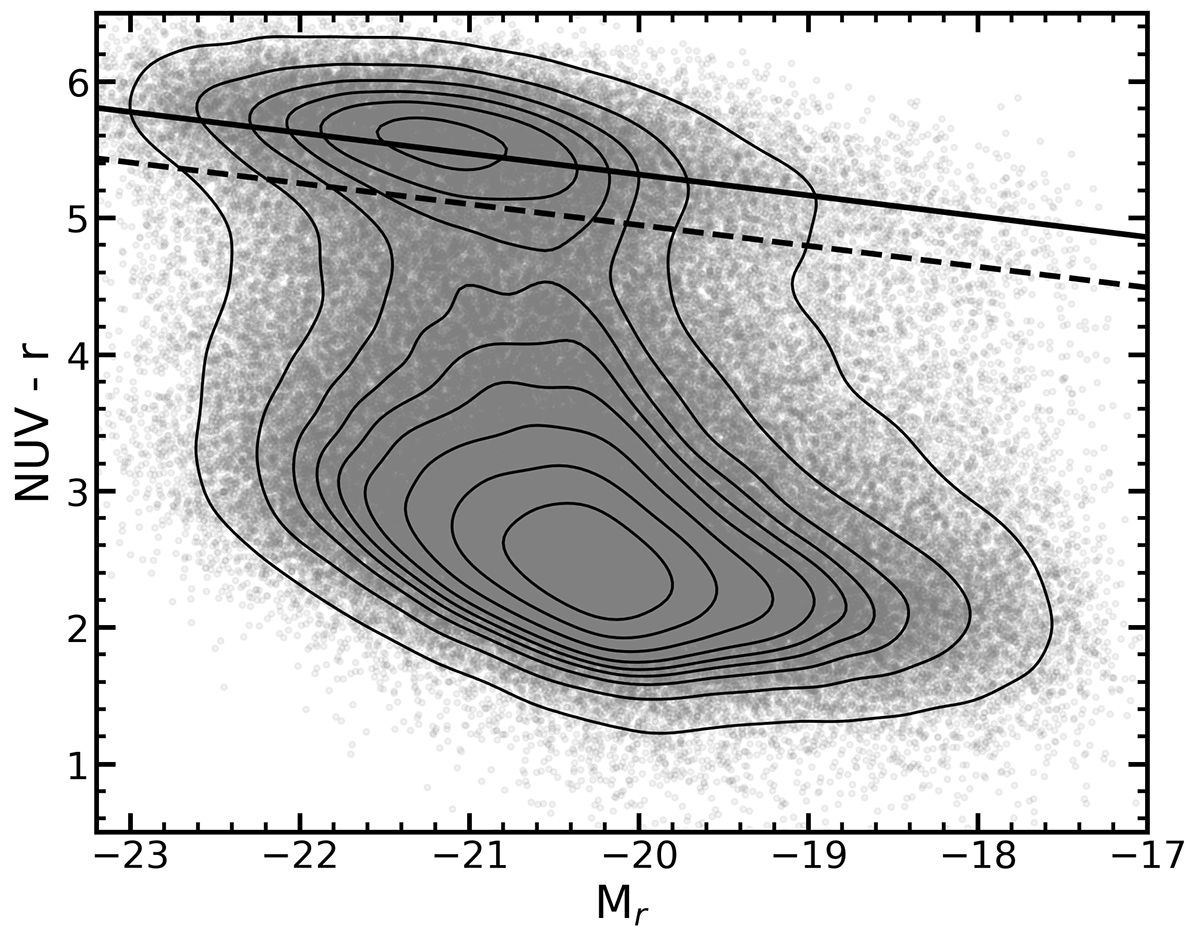
Fig. 1.
Download original image
CMD diagram of NUV − r vs. Mr. The gray dots and black contours represent the entire galaxy sample from which we selected our sample of passive galaxies. The sample of galaxies is from the SDSS. The black solid line is the best-fit color-magnitude relation defined by Haines et al. (2008), and the black dashed line is parallel to the former line, but displaced by a distance of 1σ.
Current usage metrics show cumulative count of Article Views (full-text article views including HTML views, PDF and ePub downloads, according to the available data) and Abstracts Views on Vision4Press platform.
Data correspond to usage on the plateform after 2015. The current usage metrics is available 48-96 hours after online publication and is updated daily on week days.
Initial download of the metrics may take a while.