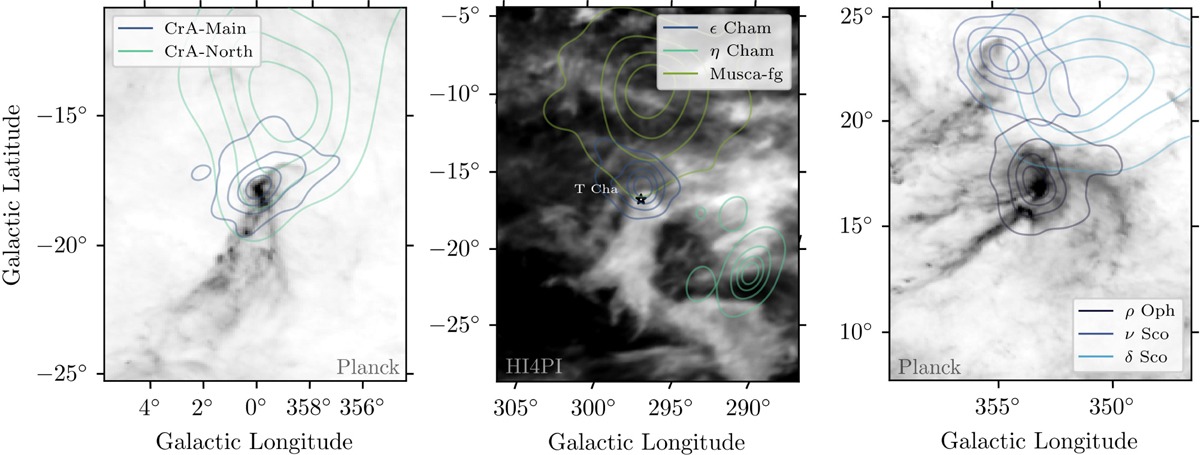
Fig. 4
Download original image
Images of the cometary-shaped residual gas structures at the end of each cluster chain. The Corona Australis and the Ophiuchus molecular clouds at the end of the CrA and Upper-Sco chais are shown with Planck 857 GHz images (Planck Collaboration XI 2014; Planck Collaboration XI 2020) in the left and right panels, respectively. In the center panel, the residual molecular cloud at the end of the LCC chain, the Blue Cloud (Boulanger et al. 1998; Nehmé et al. 2008), is shown in HI gas emission using the HI4PI data at about 5 km s−1 (HI4PI Collaboration 2016). Image dimensions are adapted to show the same physical 30×40 pc ratio at varying distances, using the distance to the youngest associated clusters CrA Main (155 pc), ϵ Cham (102 pc), and ρ Oph (139 pc). The stellar density distributions of the associated clusters of each chain are indicated with contour lines (5, 25, 50, and 75%) on top.
Current usage metrics show cumulative count of Article Views (full-text article views including HTML views, PDF and ePub downloads, according to the available data) and Abstracts Views on Vision4Press platform.
Data correspond to usage on the plateform after 2015. The current usage metrics is available 48-96 hours after online publication and is updated daily on week days.
Initial download of the metrics may take a while.