Fig. 2
Download original image
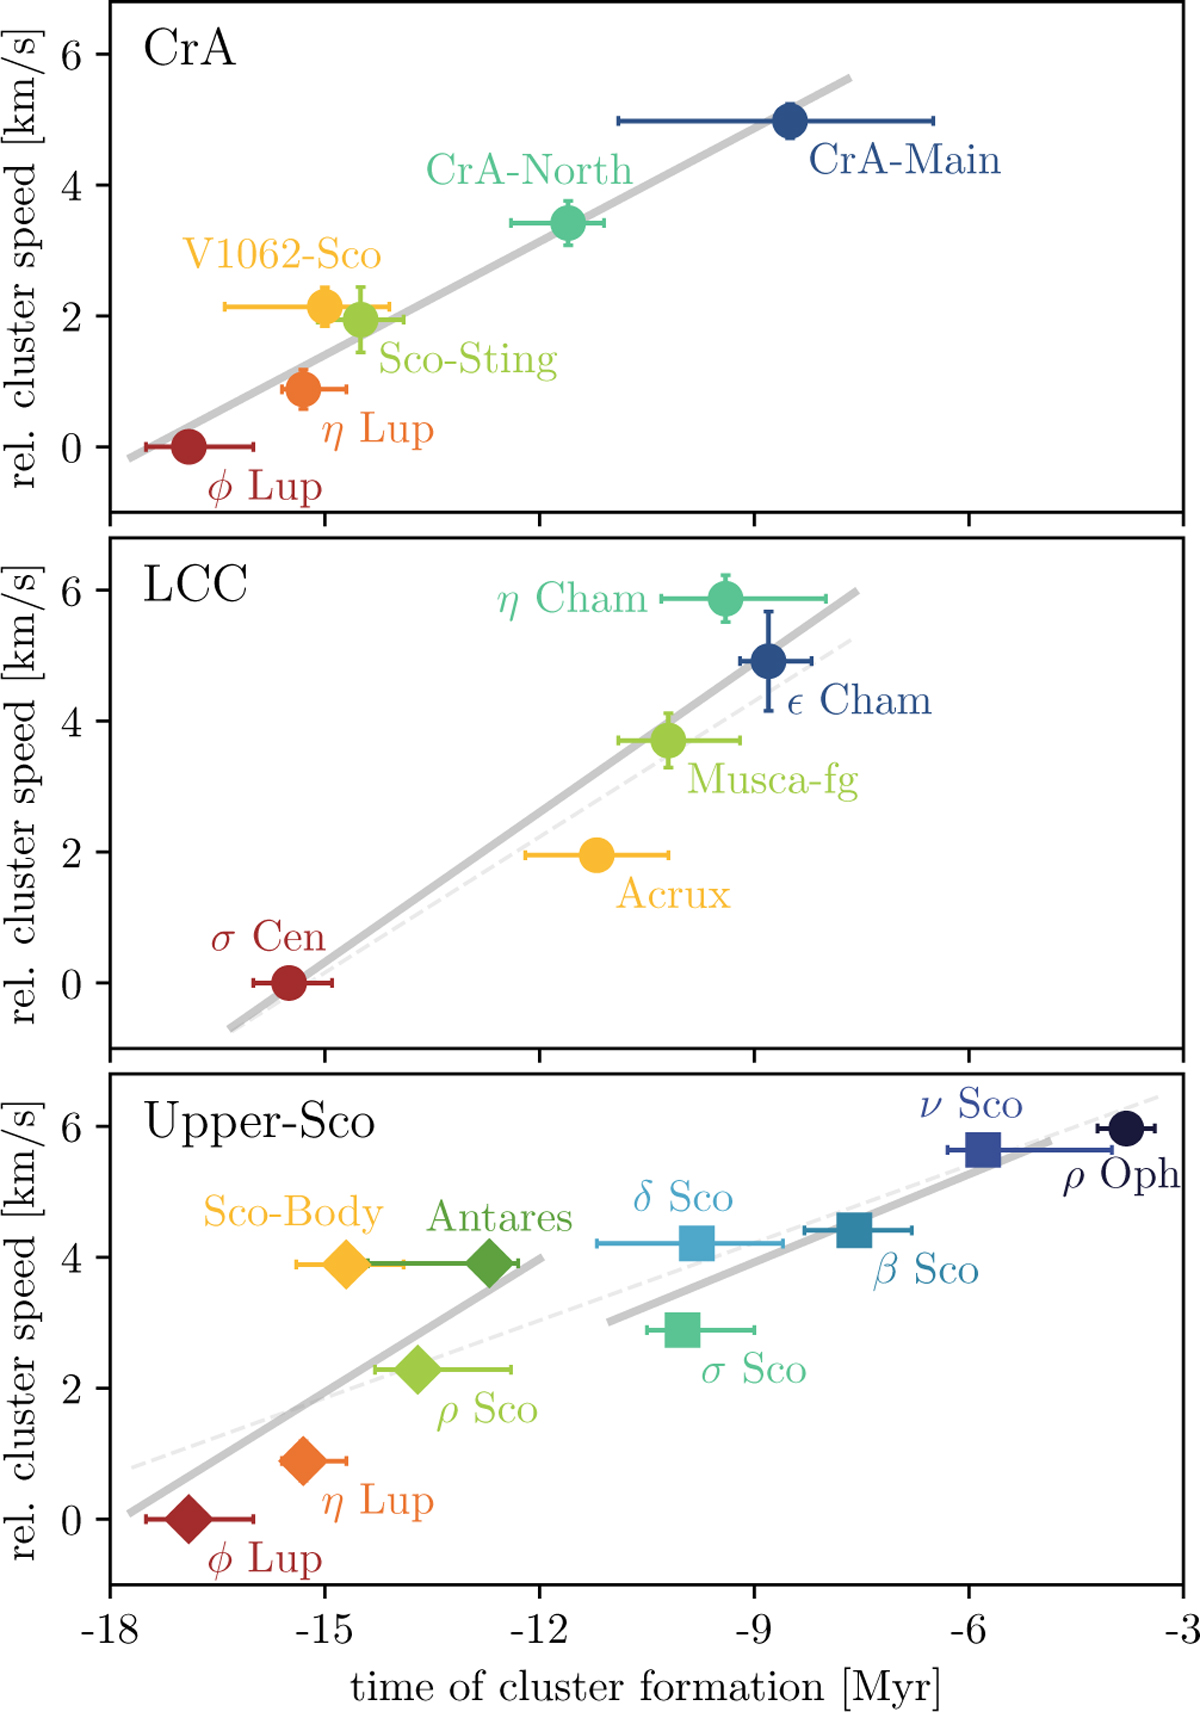
Cluster speed relative to the motion of the progenitor clusters of each chain, plotted against the time of cluster formation. We estimate the average acceleration along each cluster chain with linear regression curves (solid gray lines), including two alternative fits to the data (dashed light-gray lines). See Sect. 3.2 for details. We list the gradients in Table 1 and all fitting parameters in Table A.3. In the bottom panel, we indicate the two subchains Upper-Sco I and Upper-Sco II with diamonds and squares, respectively.
Current usage metrics show cumulative count of Article Views (full-text article views including HTML views, PDF and ePub downloads, according to the available data) and Abstracts Views on Vision4Press platform.
Data correspond to usage on the plateform after 2015. The current usage metrics is available 48-96 hours after online publication and is updated daily on week days.
Initial download of the metrics may take a while.