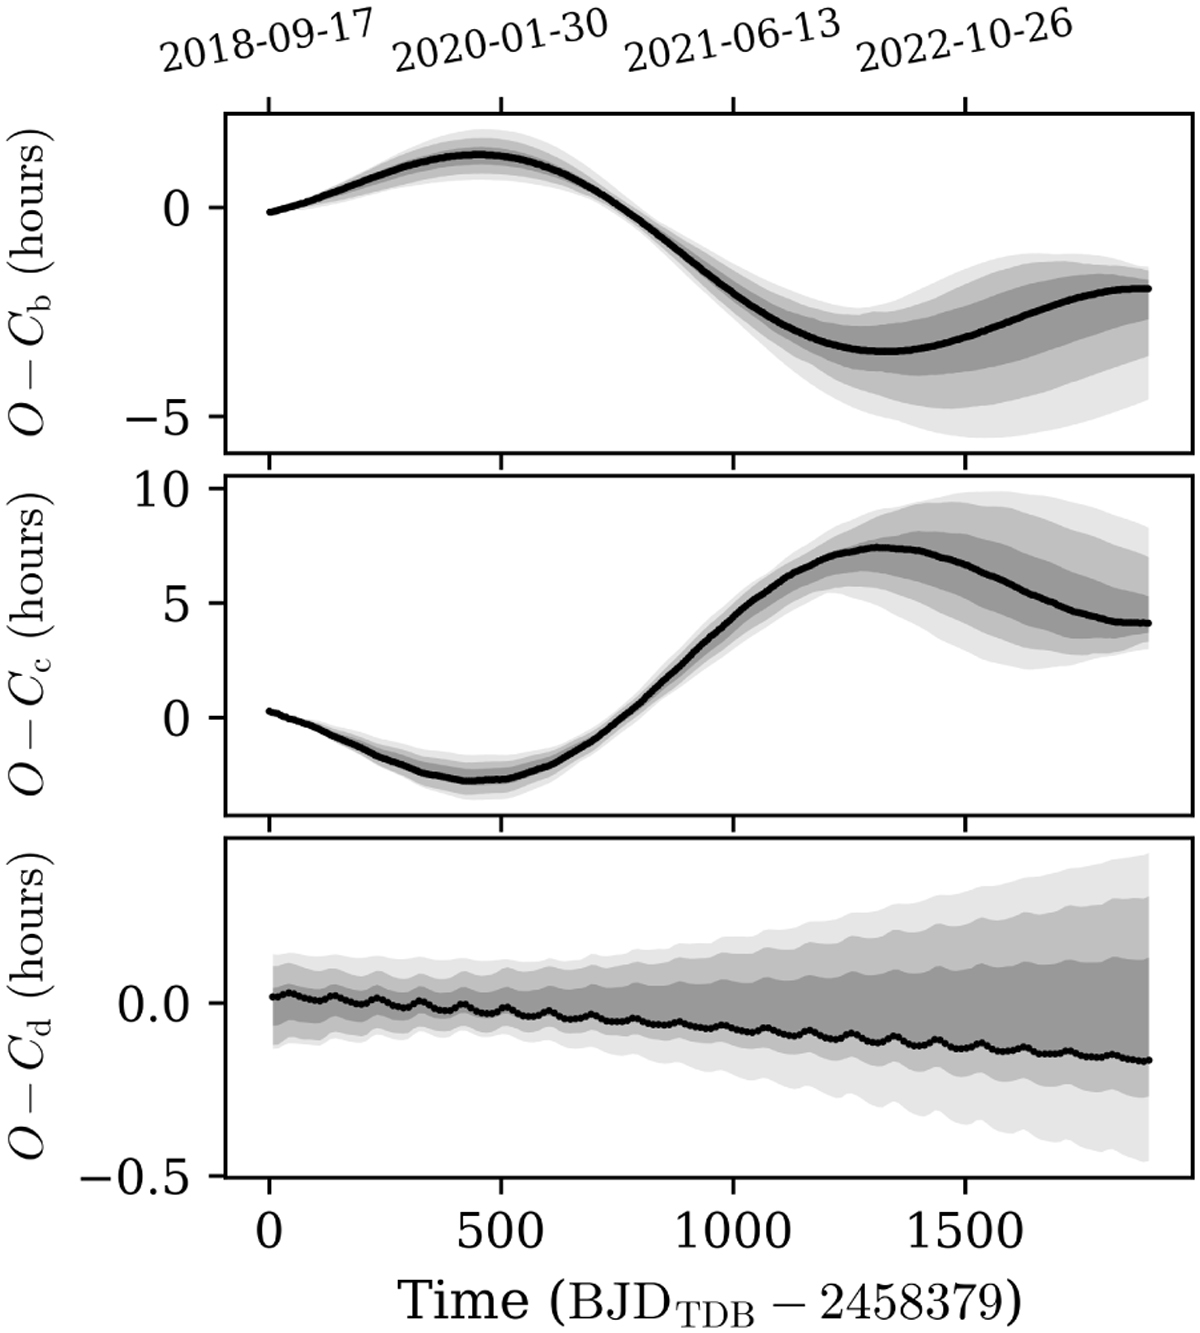
Fig. 9
Download original image
Synthetic O – C diagrams obtained after performing forward numerical N-body simulations with TRADES (integration of 5.2 years). The C represents the timings calculated from the linear ephemerides in Table 2. The MAP model is plotted with a black line, while the confidence intervals at 1, 2, and 3σ are marked as shaded grey regions and come from 200 random samples drawn from the merged posterior distributions derived from the joint RV and TTV dynamical analysis.
Current usage metrics show cumulative count of Article Views (full-text article views including HTML views, PDF and ePub downloads, according to the available data) and Abstracts Views on Vision4Press platform.
Data correspond to usage on the plateform after 2015. The current usage metrics is available 48-96 hours after online publication and is updated daily on week days.
Initial download of the metrics may take a while.