Fig. 7
Download original image
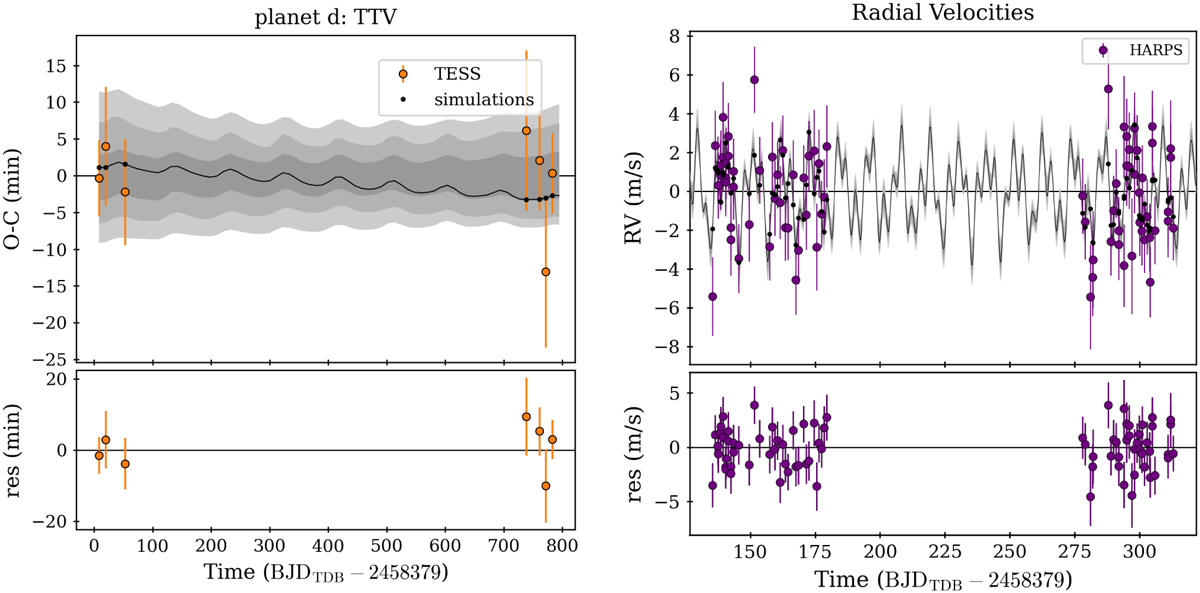
Left panel: same as Fig. 6 but for TOI-396 d. Right panel: combined RV model of the three planets (black line) superimposed to the detrended HARPS observations (purple circles). The grey shaded area is determined from the 200 sets of system parameters randomly drawn from the merged posterior distributions as obtained from the joint dynamical analysis with TRADES.
Current usage metrics show cumulative count of Article Views (full-text article views including HTML views, PDF and ePub downloads, according to the available data) and Abstracts Views on Vision4Press platform.
Data correspond to usage on the plateform after 2015. The current usage metrics is available 48-96 hours after online publication and is updated daily on week days.
Initial download of the metrics may take a while.