Fig. 6
Download original image
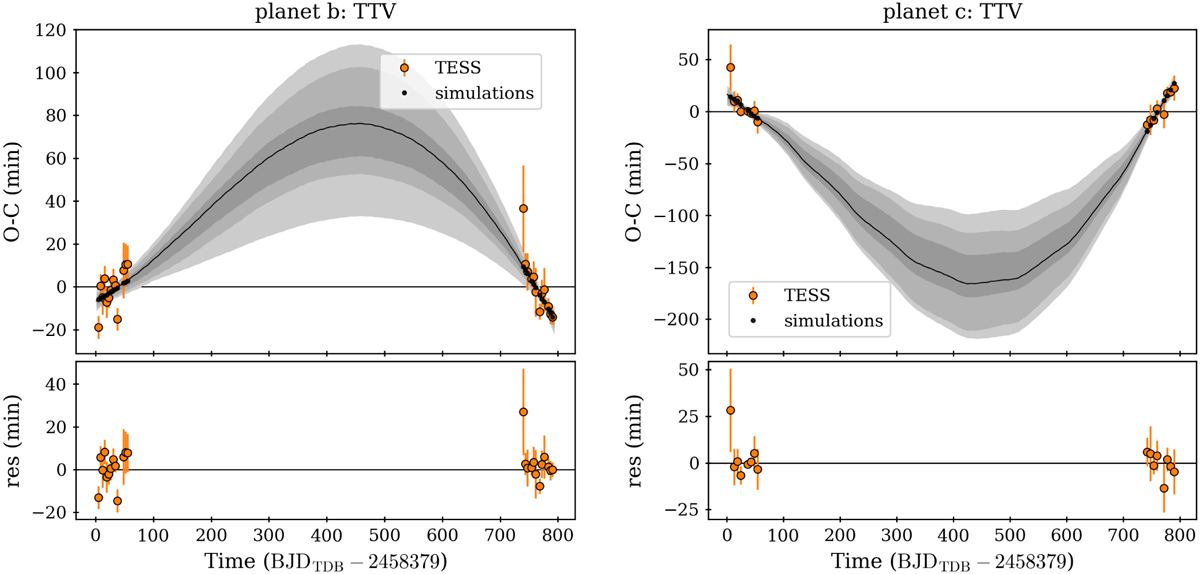
Observed minus calculated synthetic diagrams derived from the joint RV and TTV dynamical analysis with TRADES for planet b (left panel) and c (right panel). The O – C for the best-fit (MAP) model is plotted with a black line, while the observed data points are the orange circles. The shaded grey regions displays the confidence intervals at 1, 2, and 3σ, as inferred from the 200 samples randomly drawn from the merged posterior distributions. Residuals are shown in the lower panels.
Current usage metrics show cumulative count of Article Views (full-text article views including HTML views, PDF and ePub downloads, according to the available data) and Abstracts Views on Vision4Press platform.
Data correspond to usage on the plateform after 2015. The current usage metrics is available 48-96 hours after online publication and is updated daily on week days.
Initial download of the metrics may take a while.