Fig. 5

Download original image
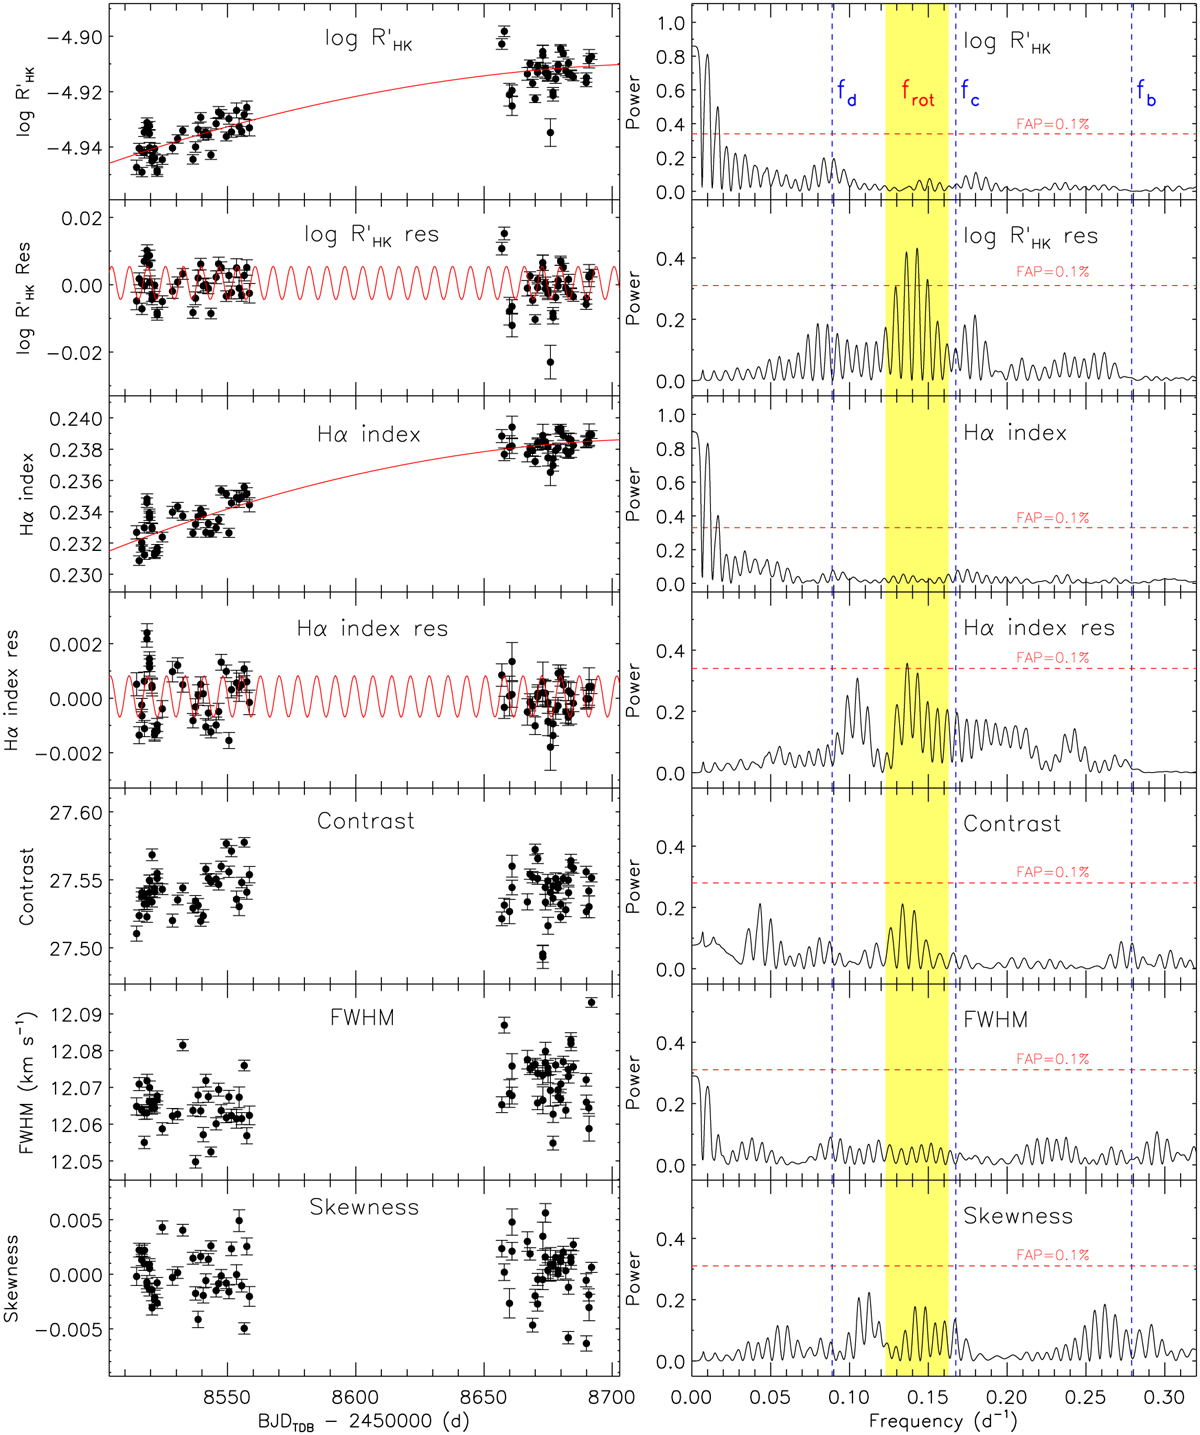
Time series (left panels) and GLS periodograms (right panels) of the line profile variation diagnostics and activity indicators extracted from TOI-396’s HARPS spectra. In the left panels, the red curves in the first four panels mark the quadratic trends and sine functions as obtained from the best fit to the most significant peaks (false alarm probability FAP < 0.1%) identified in the corresponding GLS periodograms. In the right panels, the vertical dashed blue lines mark the orbital frequencies of the tree transiting planets. The yellow area encompasses the peaks likely due to stellar rotation. The horizontal dashed red lines mark the 0.1% false alarm probability.
Current usage metrics show cumulative count of Article Views (full-text article views including HTML views, PDF and ePub downloads, according to the available data) and Abstracts Views on Vision4Press platform.
Data correspond to usage on the plateform after 2015. The current usage metrics is available 48-96 hours after online publication and is updated daily on week days.
Initial download of the metrics may take a while.


