Fig. 7.
Download original image
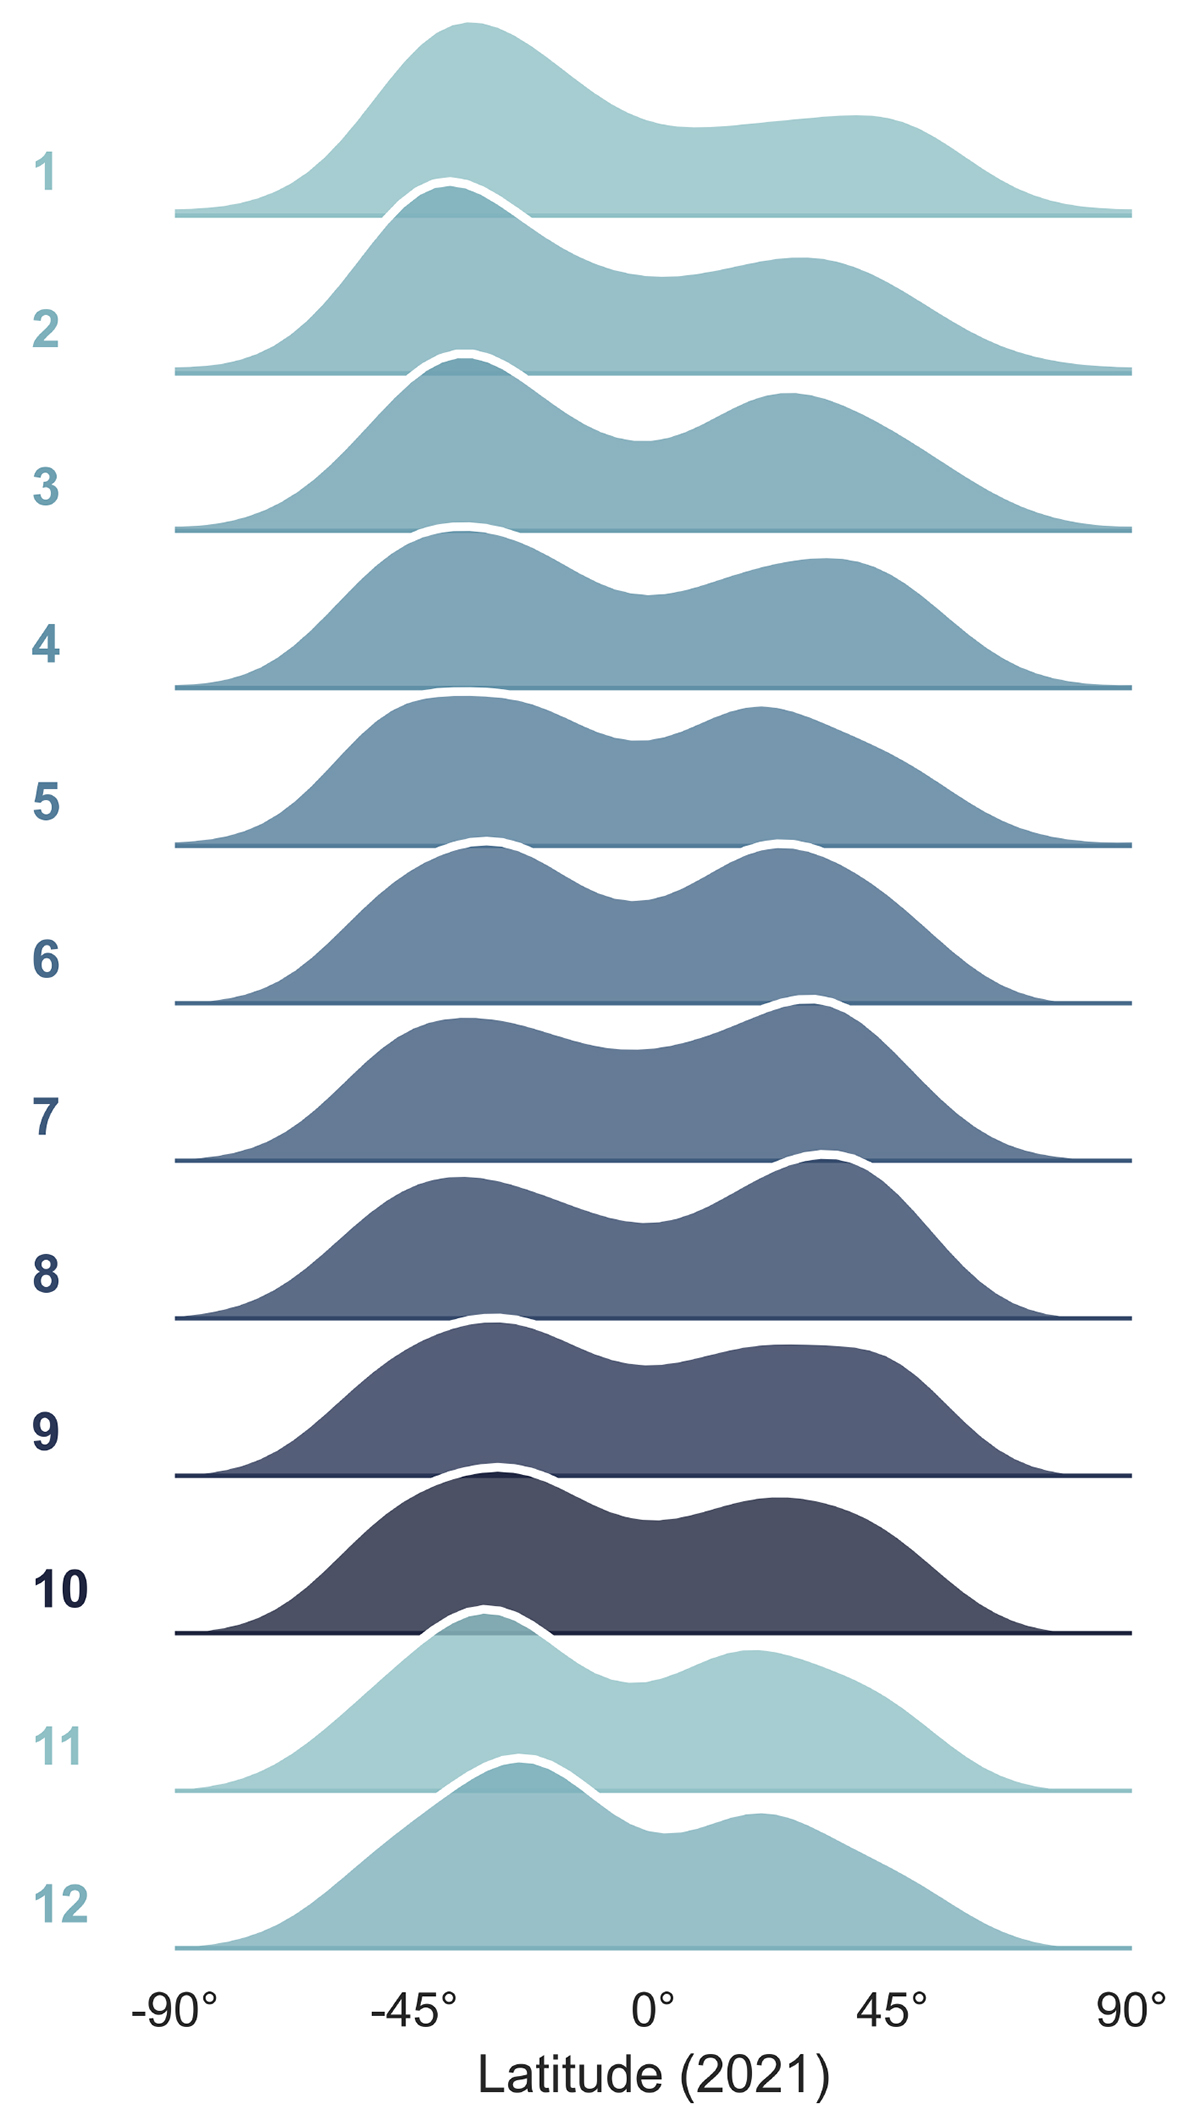
Distribution of the latitude of coronal off-limb structures per month in 2021. Row 1 corresponds to January and row 12 to December. Notably, the two expected peaks in latitude (corresponding to the active latitude belts) are not consistent across the hemispheres throughout the months, revealing a strong N-S asymmetry. There is a predominance of coronal activity in the southern hemisphere at the beginning and end of the year, while the northern hemisphere exhibits either equal or greater coronal activity during the middle of the year.
Current usage metrics show cumulative count of Article Views (full-text article views including HTML views, PDF and ePub downloads, according to the available data) and Abstracts Views on Vision4Press platform.
Data correspond to usage on the plateform after 2015. The current usage metrics is available 48-96 hours after online publication and is updated daily on week days.
Initial download of the metrics may take a while.