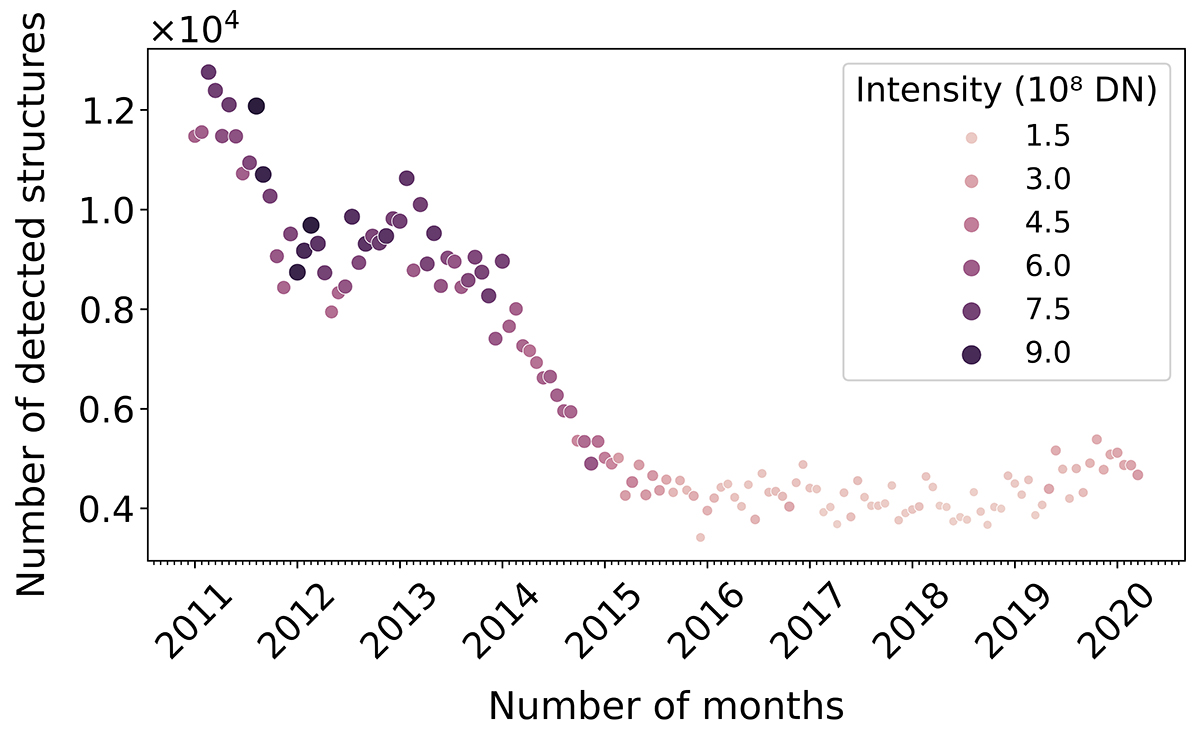
Fig. 4.
Download original image
Monthly distribution of the density and intensity of coronal off-limb structures from 1 January 2011 00:00:00 to 31 December 2021 21:00:28 UT. The structures were recorded at three-hour intervals, and the total number observed each month is displayed on the y-axis. Each dot represents the total number of observed structures per month, with the size and colour of the dots indicating their intensity. Smaller and lighter dots correspond to weaker summed intensities, while larger and darker dots represent higher summed intensities. The intensity and number of detected structures are correlated. A peak in both density and intensity occurs in 2013, while the overall trend shows a sharp decline throughout SC 24, with a slight increase at the beginning of the next cycle around 2019–2020.
Current usage metrics show cumulative count of Article Views (full-text article views including HTML views, PDF and ePub downloads, according to the available data) and Abstracts Views on Vision4Press platform.
Data correspond to usage on the plateform after 2015. The current usage metrics is available 48-96 hours after online publication and is updated daily on week days.
Initial download of the metrics may take a while.