Fig. 15.
Download original image
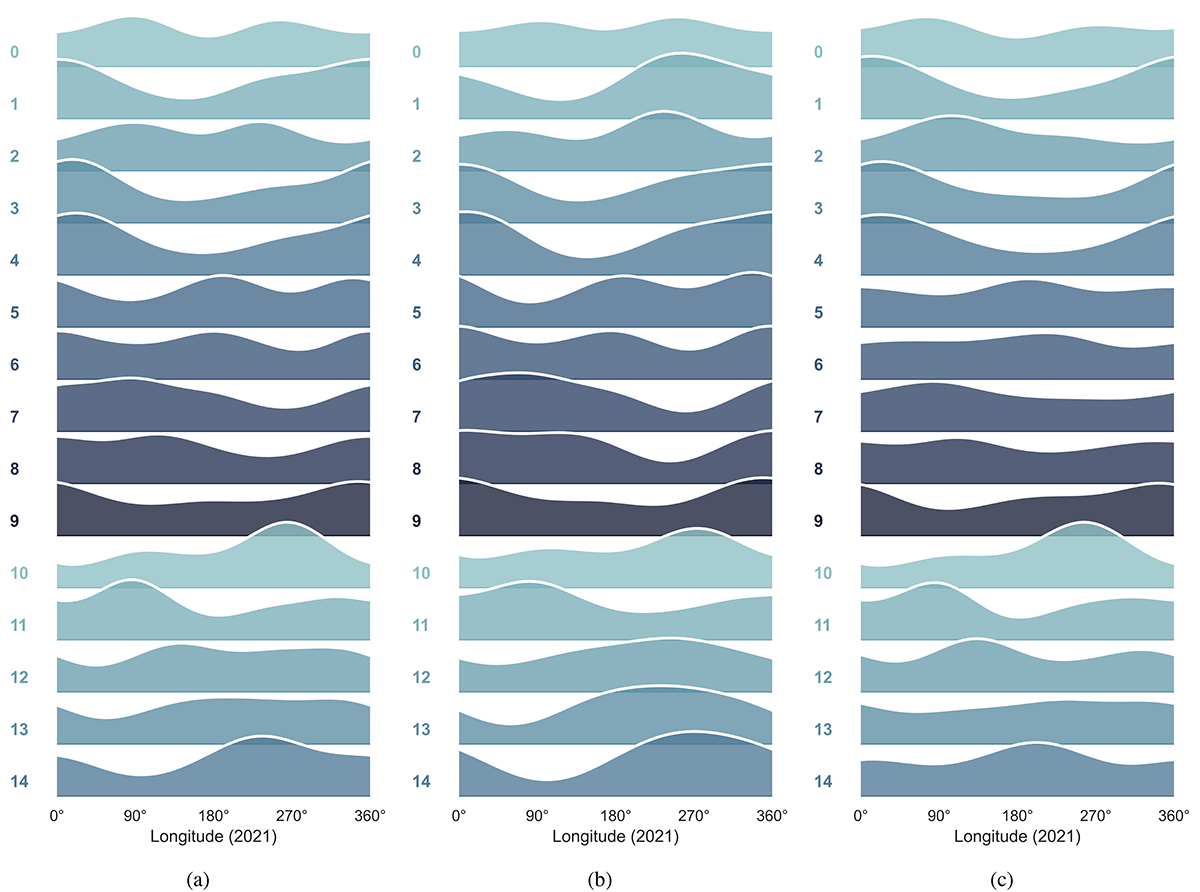
Distribution of the longitude of coronal off-limb structures over a 25-day period in 2021, shown for different latitude belts centred around the equator. Panel (a) shows the longitudinal distribution centred around 0° latitude with a range of ±5°, while panel (b) displays the longitudinal distribution over the northern part of this belt (0° to 5° latitude), and panel (c) over the southern part (−5° to 0° latitude).
Current usage metrics show cumulative count of Article Views (full-text article views including HTML views, PDF and ePub downloads, according to the available data) and Abstracts Views on Vision4Press platform.
Data correspond to usage on the plateform after 2015. The current usage metrics is available 48-96 hours after online publication and is updated daily on week days.
Initial download of the metrics may take a while.