Open Access
Fig. 12.
Download original image
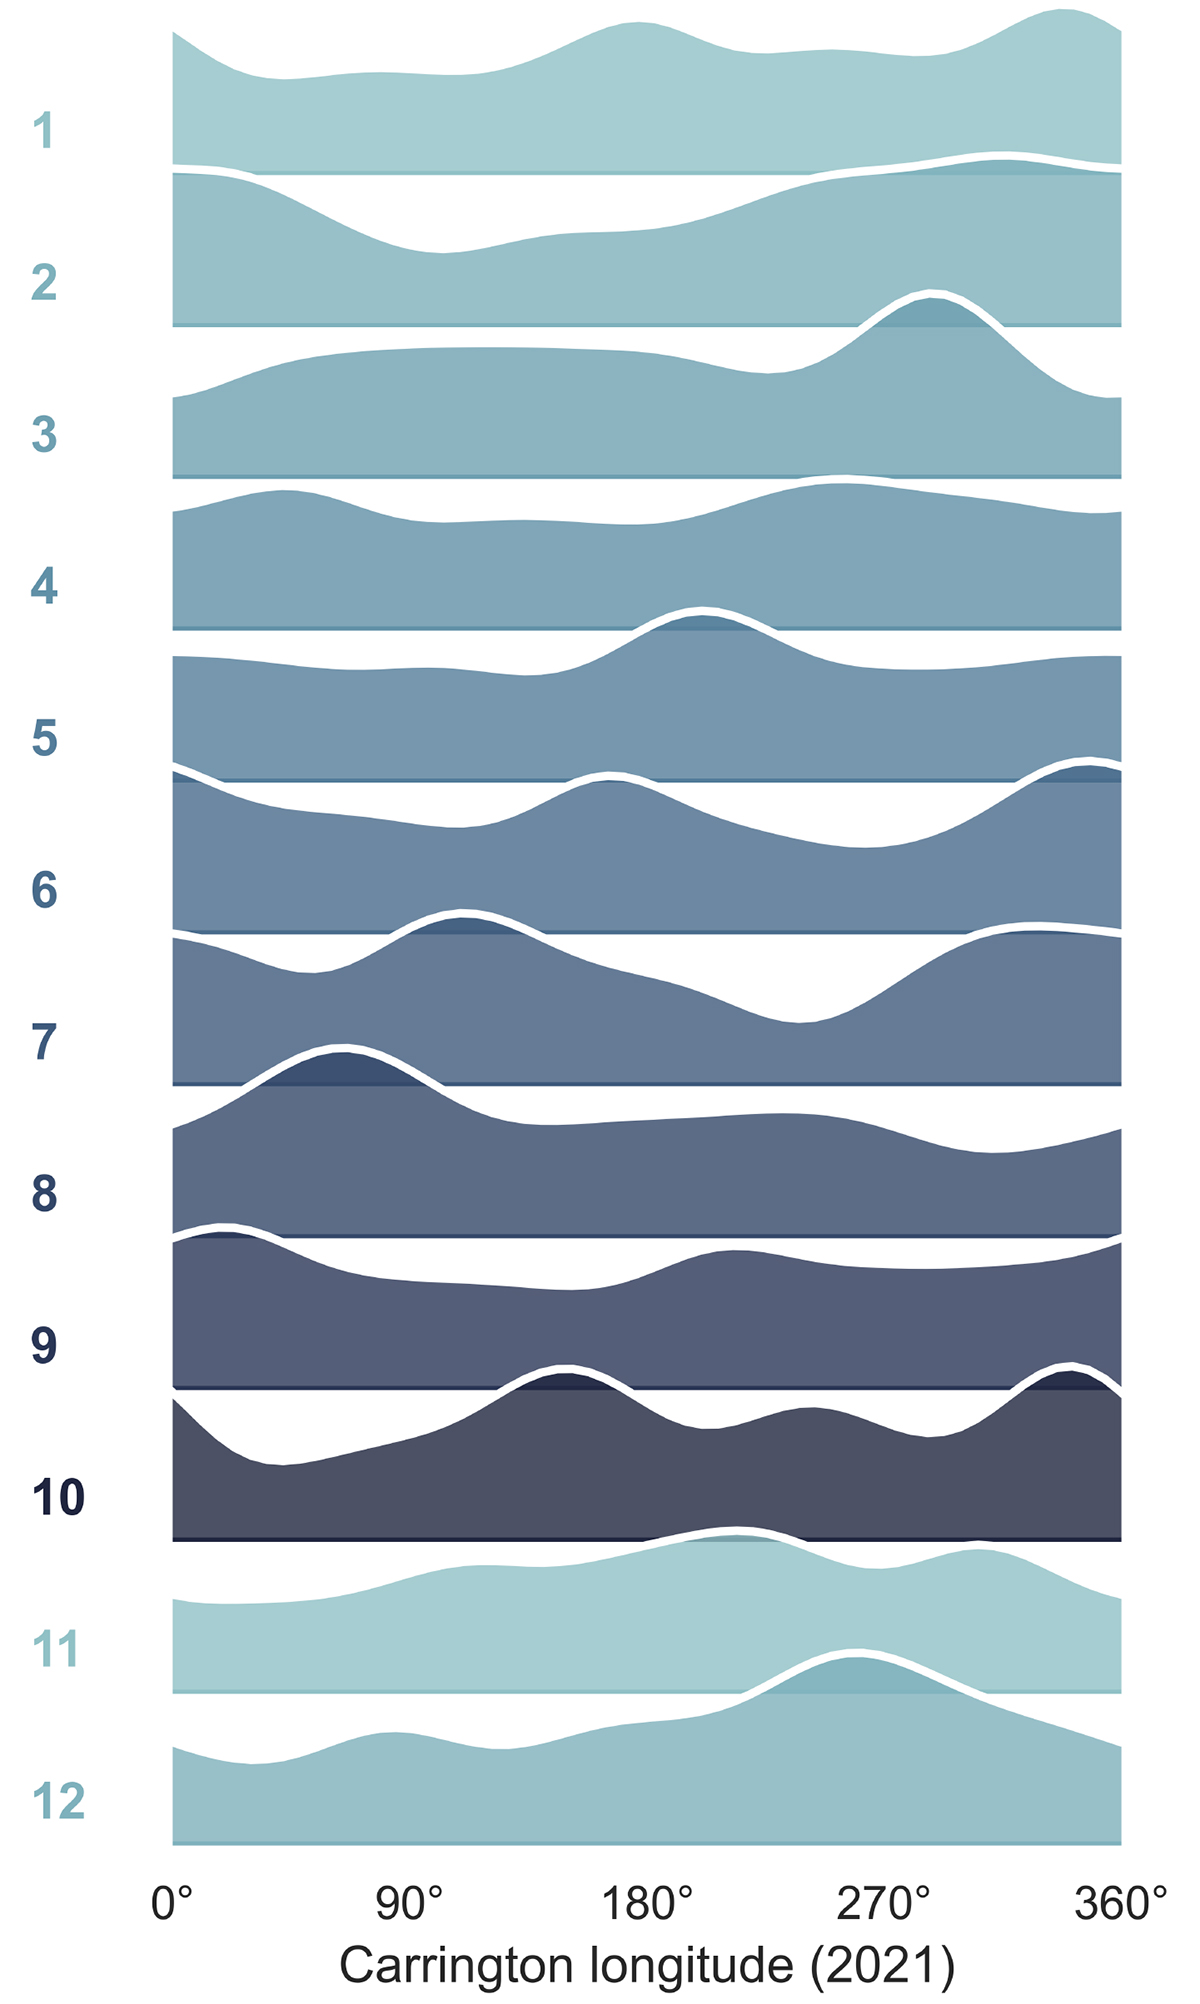
Distribution of the longitude of coronal off-limb structures per month in 2021. Row 1 corresponds to January and row 12 to December. Notably, there are significant longitudinal peaks of coronal activity, with approximately one to three peaks occurring each month. These peaks exhibit a gradual shift in longitude over time.
Current usage metrics show cumulative count of Article Views (full-text article views including HTML views, PDF and ePub downloads, according to the available data) and Abstracts Views on Vision4Press platform.
Data correspond to usage on the plateform after 2015. The current usage metrics is available 48-96 hours after online publication and is updated daily on week days.
Initial download of the metrics may take a while.