Fig. 8
Download original image
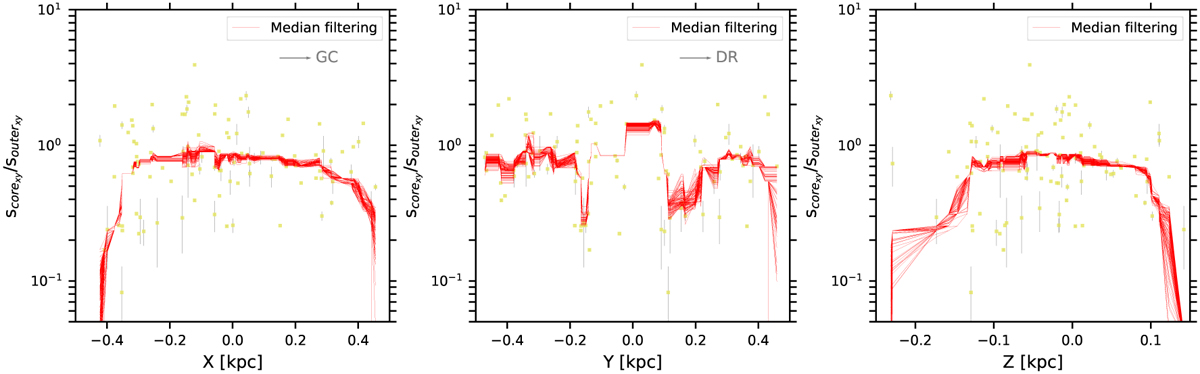
Distributions between the morphological stability of the projected distribution within tidal radii of sample clusters on the X-Y plane and the three axes (X axis, Y axis, and Z axis). ‘GC’ and ‘DR’ represent the Galactic center and the Galactic differential rotation, respectively. The colored scatters with gray error bars denote our sample clusters, with the red curve lines of each panel being the median filtering lines to the distribution of the panel. These red median filtering lines are obtained by sampling the parameters distributed in the figure 100 times using a Gaussian distribution within the range of error and filtering the median of the parameter distribution for each of these 100 sampling times. It should be noted that the number of samples in each panel is not equal to that of all samples. Because we removed those samples with the central core area (S corexy) being zero.
Current usage metrics show cumulative count of Article Views (full-text article views including HTML views, PDF and ePub downloads, according to the available data) and Abstracts Views on Vision4Press platform.
Data correspond to usage on the plateform after 2015. The current usage metrics is available 48-96 hours after online publication and is updated daily on week days.
Initial download of the metrics may take a while.