Fig. 5
Download original image
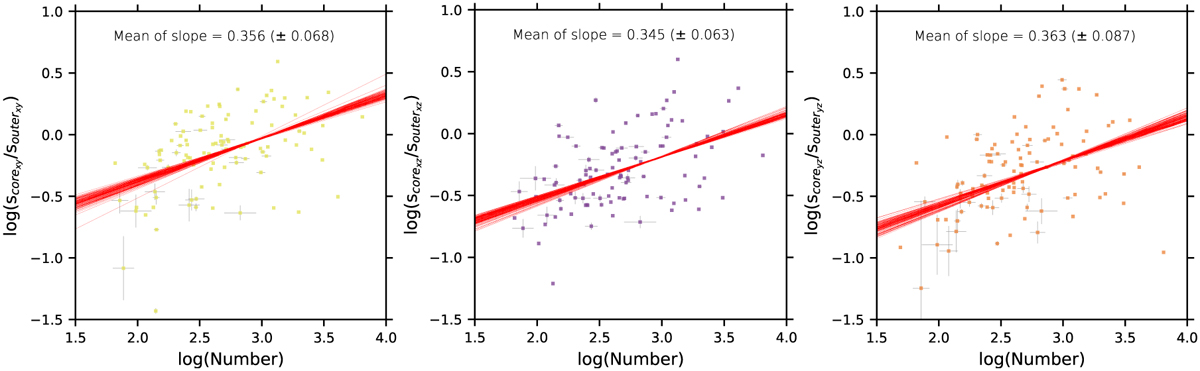
Logarithm of the morphological stability of sample clusters on three different projections within tidal radii vs. logarithm of the number of the sample cluster members within tidal radii. The different colored scatters with gray error bars (left: X-Y plane, middle: X-Z plane, and right: Y-Z plane) indicate the sample clusters, with the horizontal and vertical gray error bars representing the errors on the horizontal and vertical axes, respectively. The solid red lines are linear fit lines, which were obtained by sampling the parameters distributed in the plot 100 times within their error ranges using a Gaussian distribution, and linearly fitting the parameter distributions for each of these 100 times of samples. The slope in each label is the mean of the slopes of the 100 linear fits, with the value in the parenthesis being the mean of the standard deviation of the slopes of the 100 linear fits. It should be noted that the number of samples in each panel is not equal to that of all samples. Because we removed those samples with the central core area (![]() , or
, or ![]() , or
, or ![]() ) being zero.
) being zero.
Current usage metrics show cumulative count of Article Views (full-text article views including HTML views, PDF and ePub downloads, according to the available data) and Abstracts Views on Vision4Press platform.
Data correspond to usage on the plateform after 2015. The current usage metrics is available 48-96 hours after online publication and is updated daily on week days.
Initial download of the metrics may take a while.