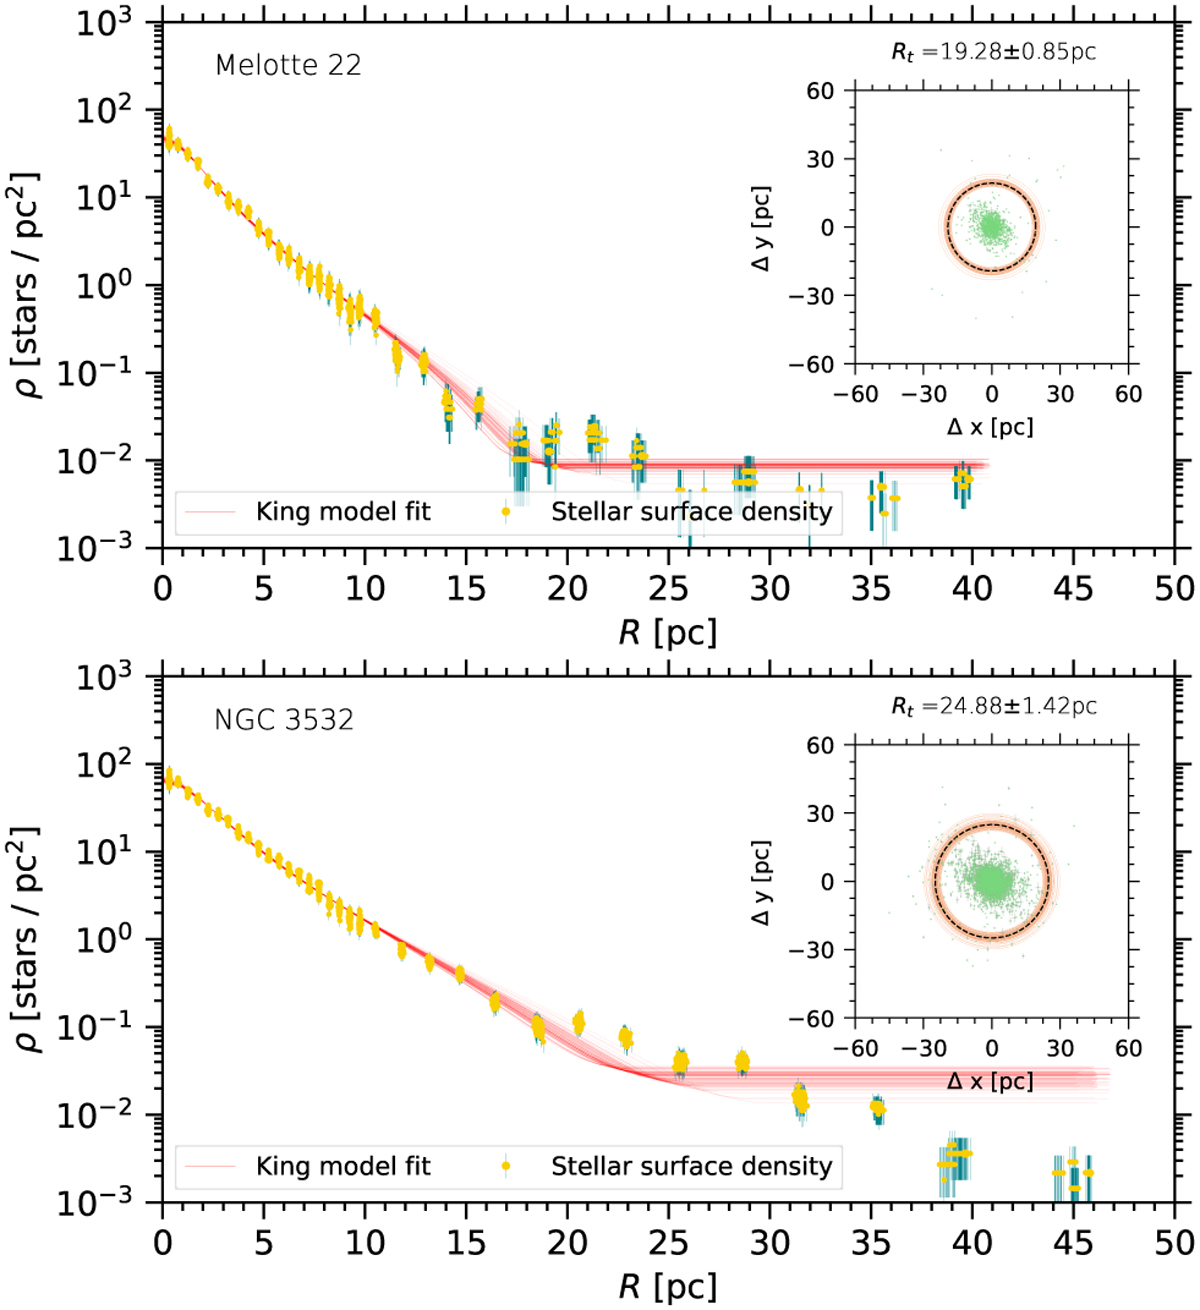
Fig. 1
Download original image
Surface density profiles of the two sample clusters (Top: Melotte 22 and Bottom: NGC 3532) and their projection distributions in the 2D celestial coordinate frame. The radii of the colored circles in the subplots are the tidal radii of the sample clusters, derived from 100 times of King model fitting. The black dashed circle in each subplot is plotted based on the mean of the tidal radii. The green dots with gray error bars represent the sample cluster member stars, with the gray error bars being the errors of the coordinates of these members. The red solid lines denote the surface density profiles of the two clusters.
Current usage metrics show cumulative count of Article Views (full-text article views including HTML views, PDF and ePub downloads, according to the available data) and Abstracts Views on Vision4Press platform.
Data correspond to usage on the plateform after 2015. The current usage metrics is available 48-96 hours after online publication and is updated daily on week days.
Initial download of the metrics may take a while.