Fig. 8
Download original image
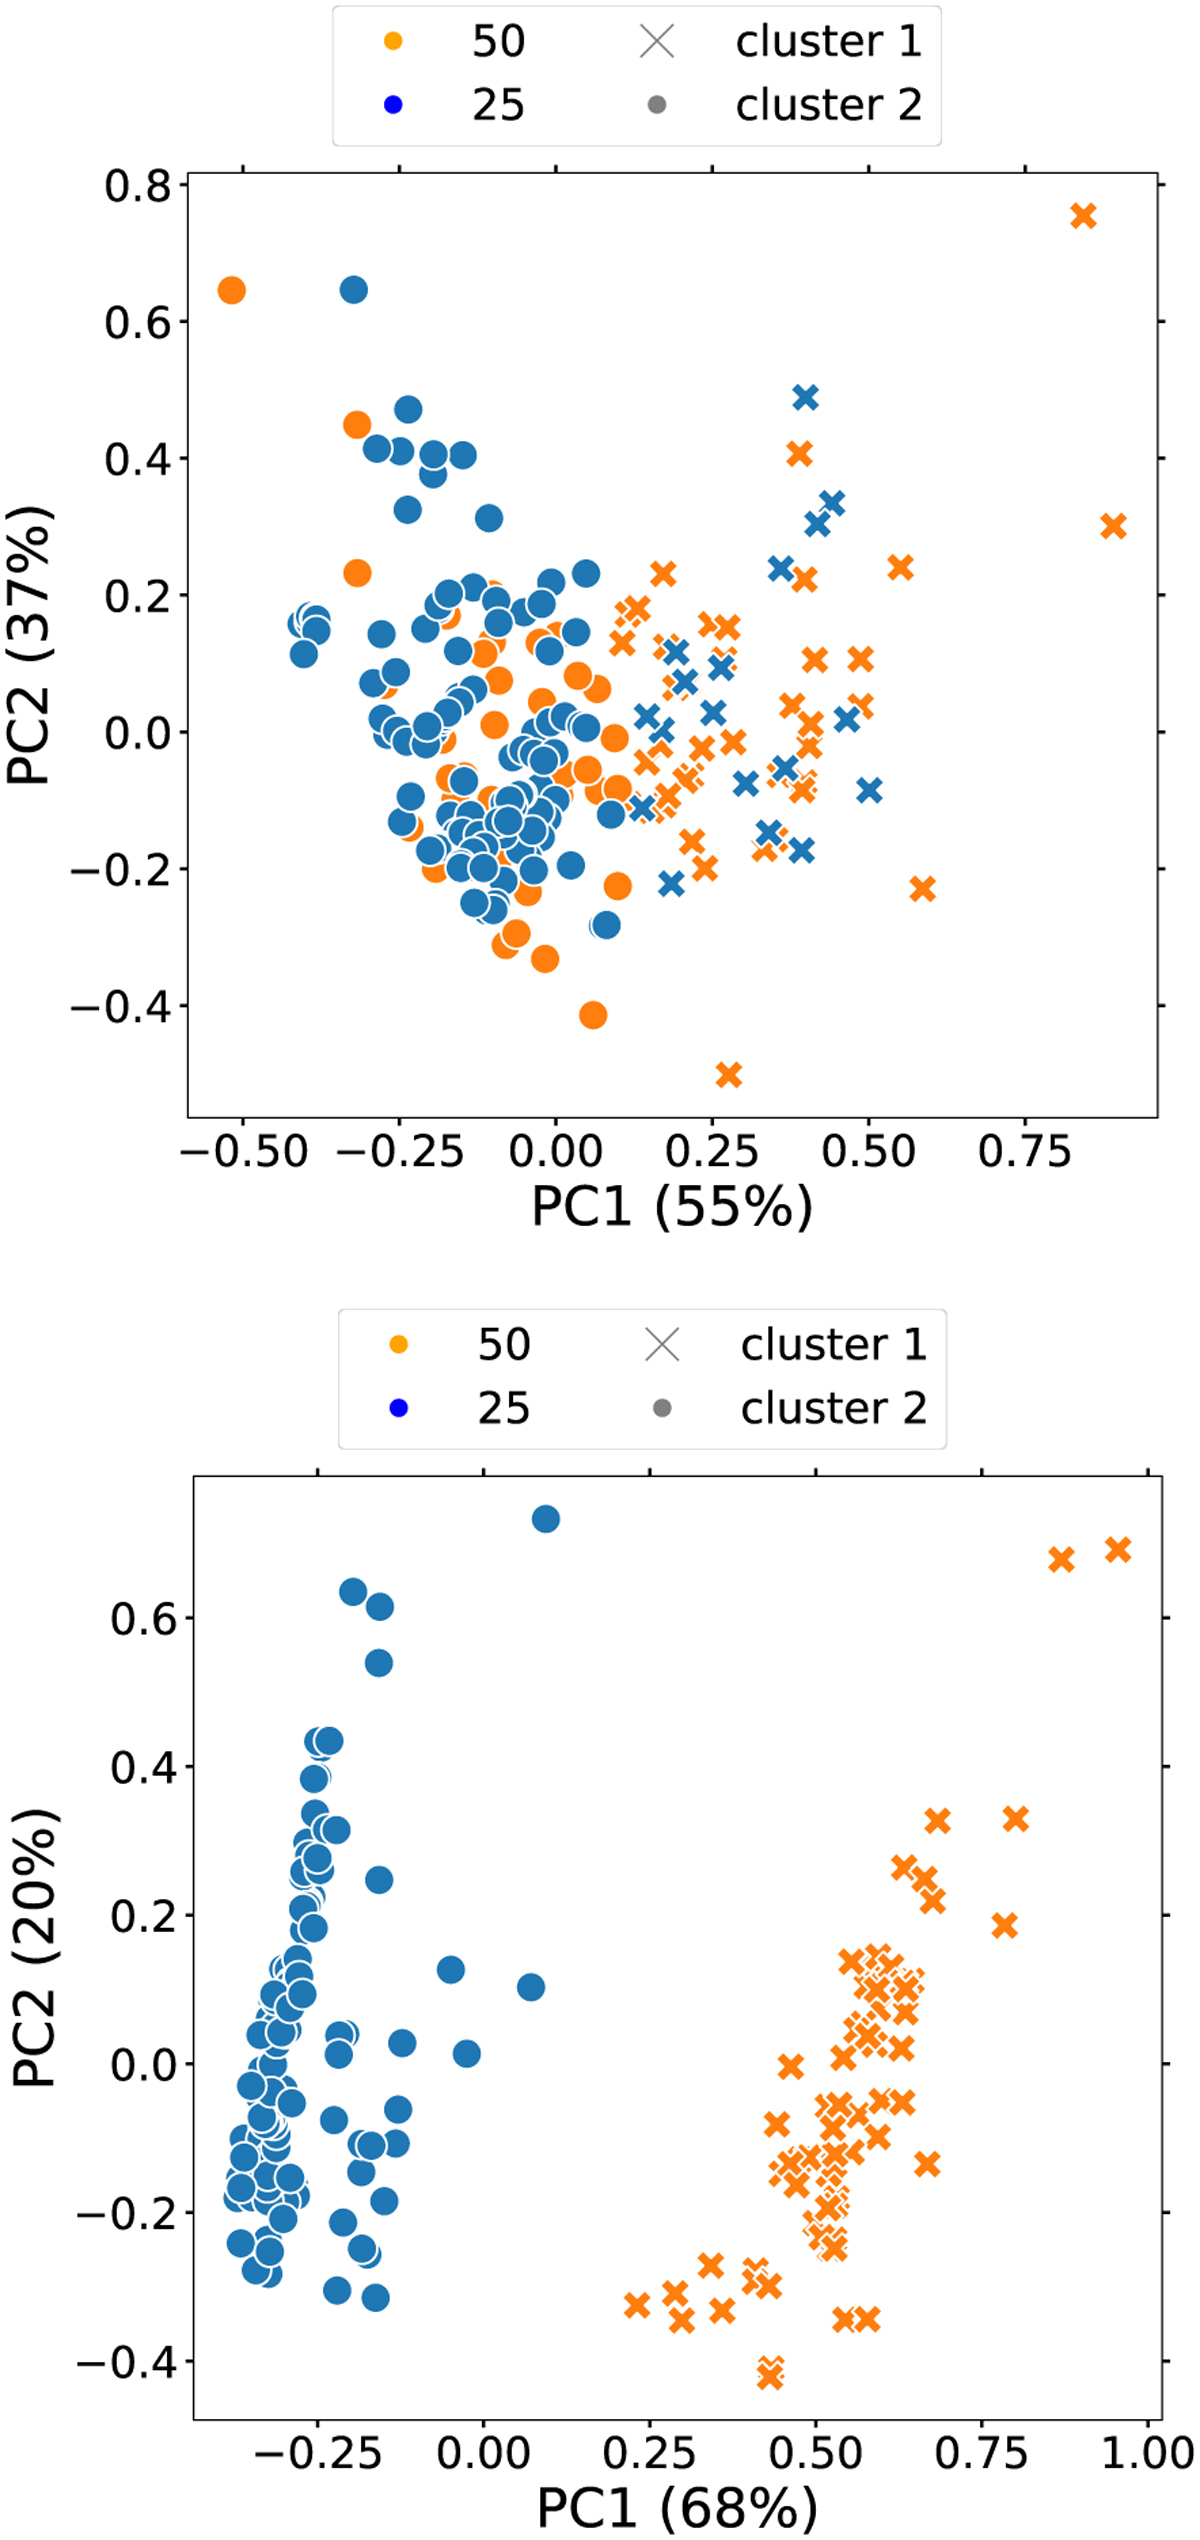
Clustering of all data (‘MC1’) with k-means after PCA algorithm for line ratios without attenuation (‘MC1unatt’, top panel) and with attenuation (‘MC1att’, bottom panel). Colours represent real datasets; symbols represent predicted datasets. The best result shows the line ratios with attenuation (bottom panel). There, we can separate the different distances from the SN explosion to the centre of mass of the MC.
Current usage metrics show cumulative count of Article Views (full-text article views including HTML views, PDF and ePub downloads, according to the available data) and Abstracts Views on Vision4Press platform.
Data correspond to usage on the plateform after 2015. The current usage metrics is available 48-96 hours after online publication and is updated daily on week days.
Initial download of the metrics may take a while.