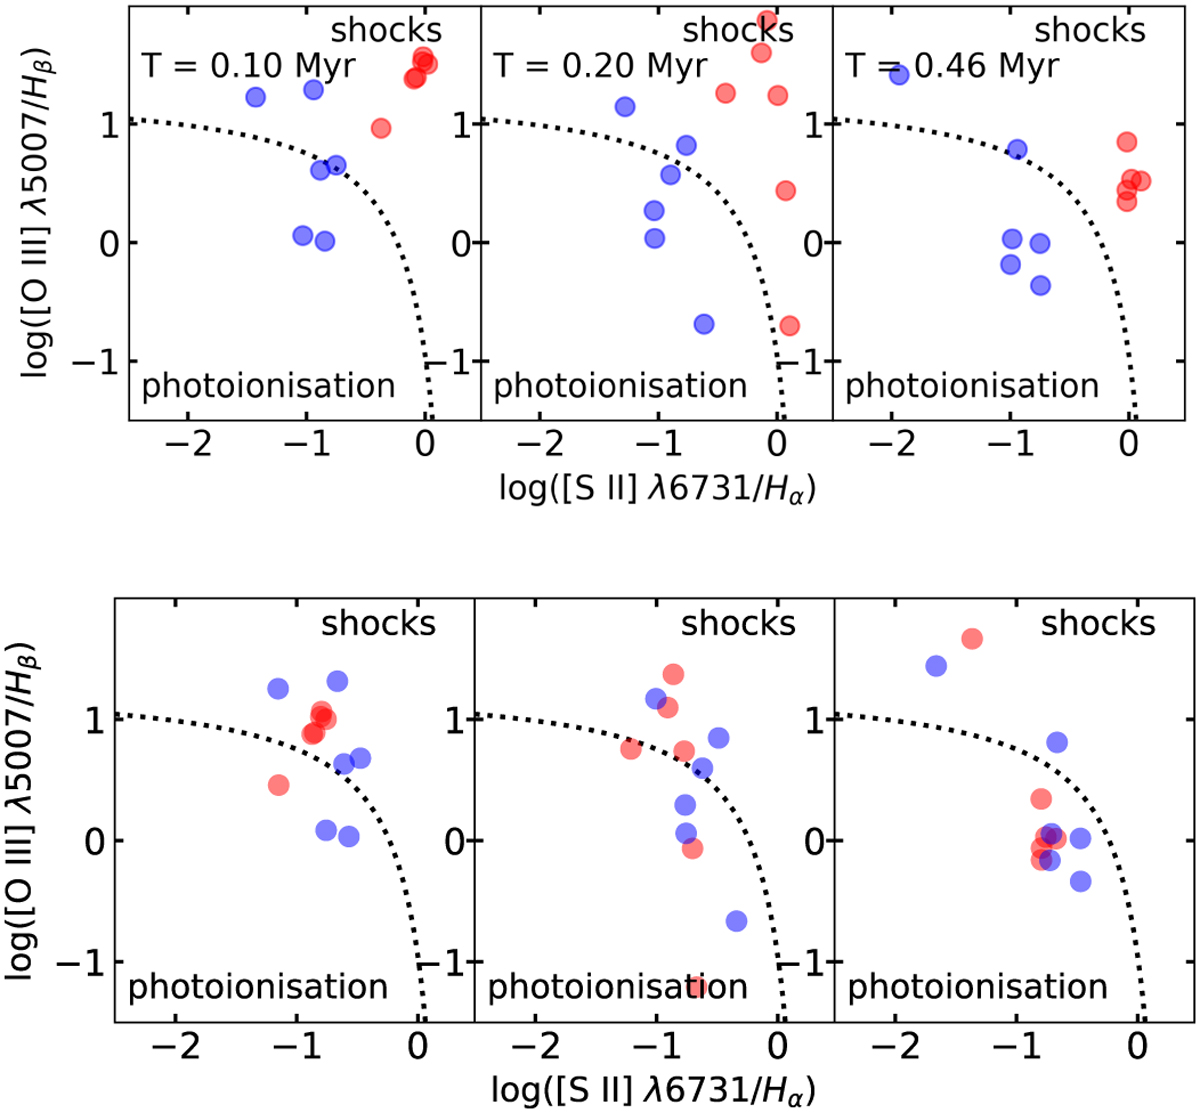
Fig. D.1
Download original image
Sulphur BPT diagram for unattenuated line emission with added random noise. Colours are the same as in Fig. 6. On the lower panel, noise is higher than the real attenuation percentage (around 80% ± 10%, see Table 2). On the upper panel, noise is lower than the calculated attenuation (around 20% ± 10%). The upper panel’s circles can be well separated during the whole time evolution (from left to right).
Current usage metrics show cumulative count of Article Views (full-text article views including HTML views, PDF and ePub downloads, according to the available data) and Abstracts Views on Vision4Press platform.
Data correspond to usage on the plateform after 2015. The current usage metrics is available 48-96 hours after online publication and is updated daily on week days.
Initial download of the metrics may take a while.