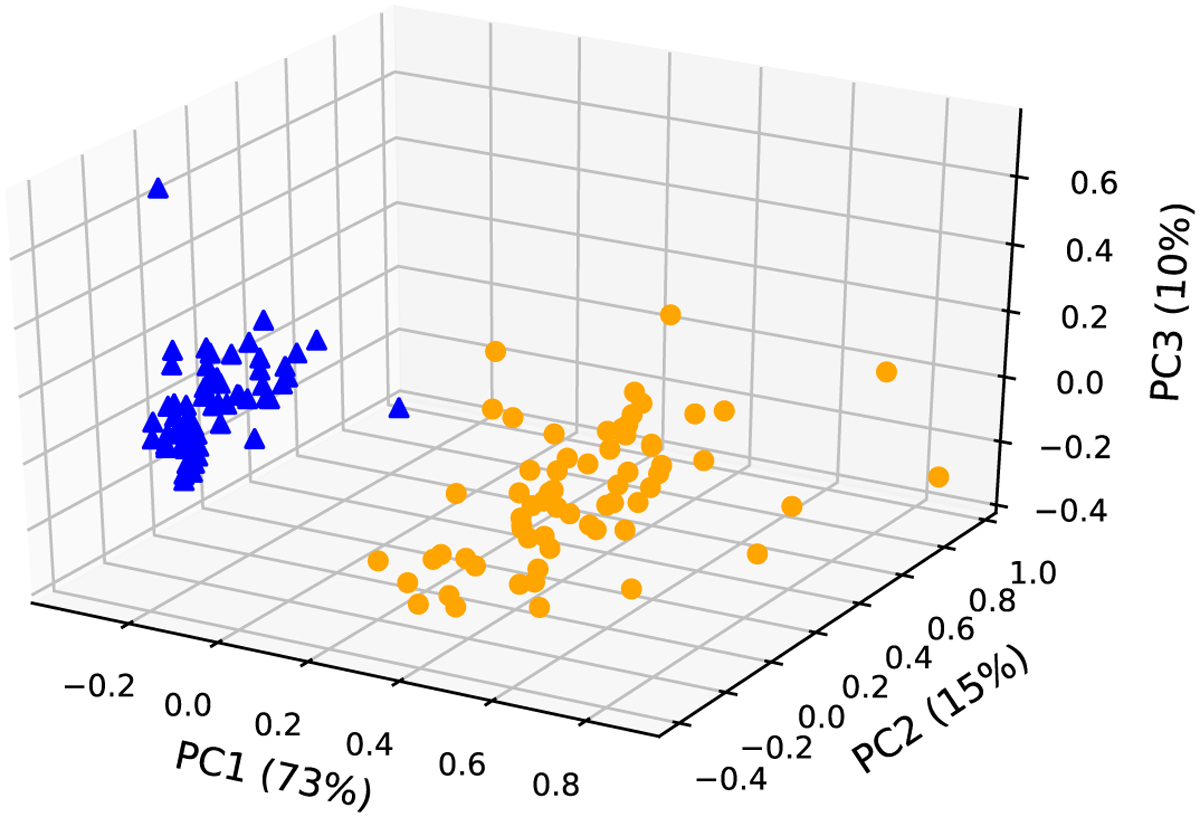
Fig. C.1
Download original image
3D representation of the data ’MHD25’+’HD25’ (blue) and ’MHD50’+’HD50’ (orange) after the PCA step. The predicted clusters are marked with circles and triangles. The contribution of each PC is as follows: 73% for PC1, 15% for PC2, and 10% for PC3. As in Fig. 3, we can still clearly see two clusters. However, visually, PC3 does not allow more efficient separation of clusters. Thus, in this work, 2D visualisation was mainly used (only the two PCs).
Current usage metrics show cumulative count of Article Views (full-text article views including HTML views, PDF and ePub downloads, according to the available data) and Abstracts Views on Vision4Press platform.
Data correspond to usage on the plateform after 2015. The current usage metrics is available 48-96 hours after online publication and is updated daily on week days.
Initial download of the metrics may take a while.