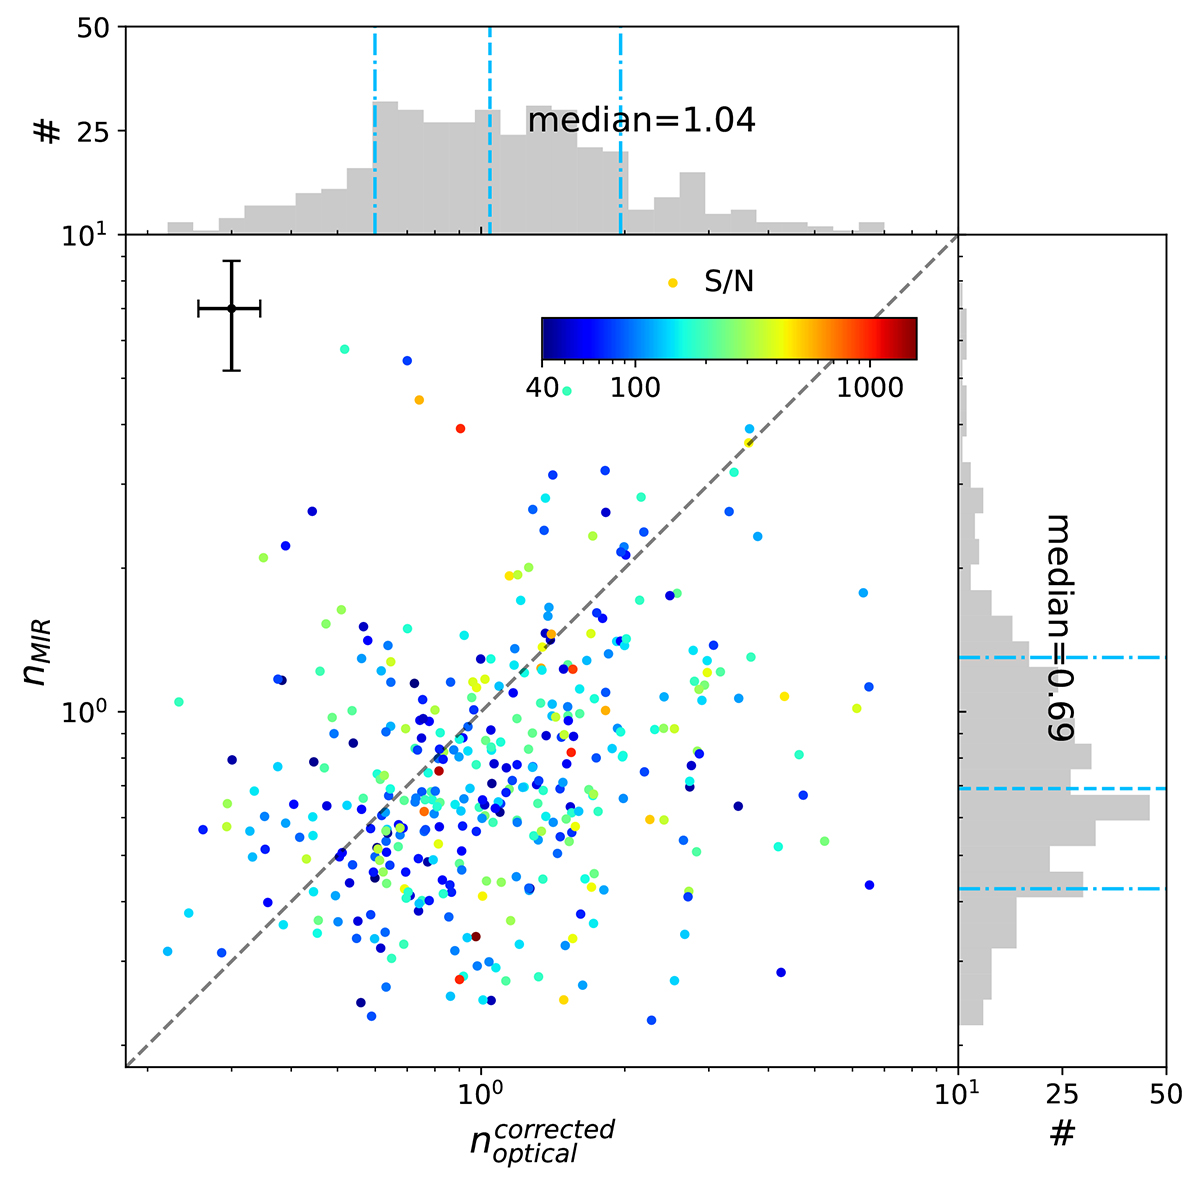
Fig. 7.
Download original image
Optical Sérsic index versus MIR Sérsic index inferred from strategy 1, color-coded by their S/N. The median error bar is shown in black in the upper left. The dashed gray line shows the 1-to-1 line. The corresponding distributions are shown in the sidebars, with the median value and 16th/84th percentiles indicated with dashed and dash-dotted blue lines.
Current usage metrics show cumulative count of Article Views (full-text article views including HTML views, PDF and ePub downloads, according to the available data) and Abstracts Views on Vision4Press platform.
Data correspond to usage on the plateform after 2015. The current usage metrics is available 48-96 hours after online publication and is updated daily on week days.
Initial download of the metrics may take a while.