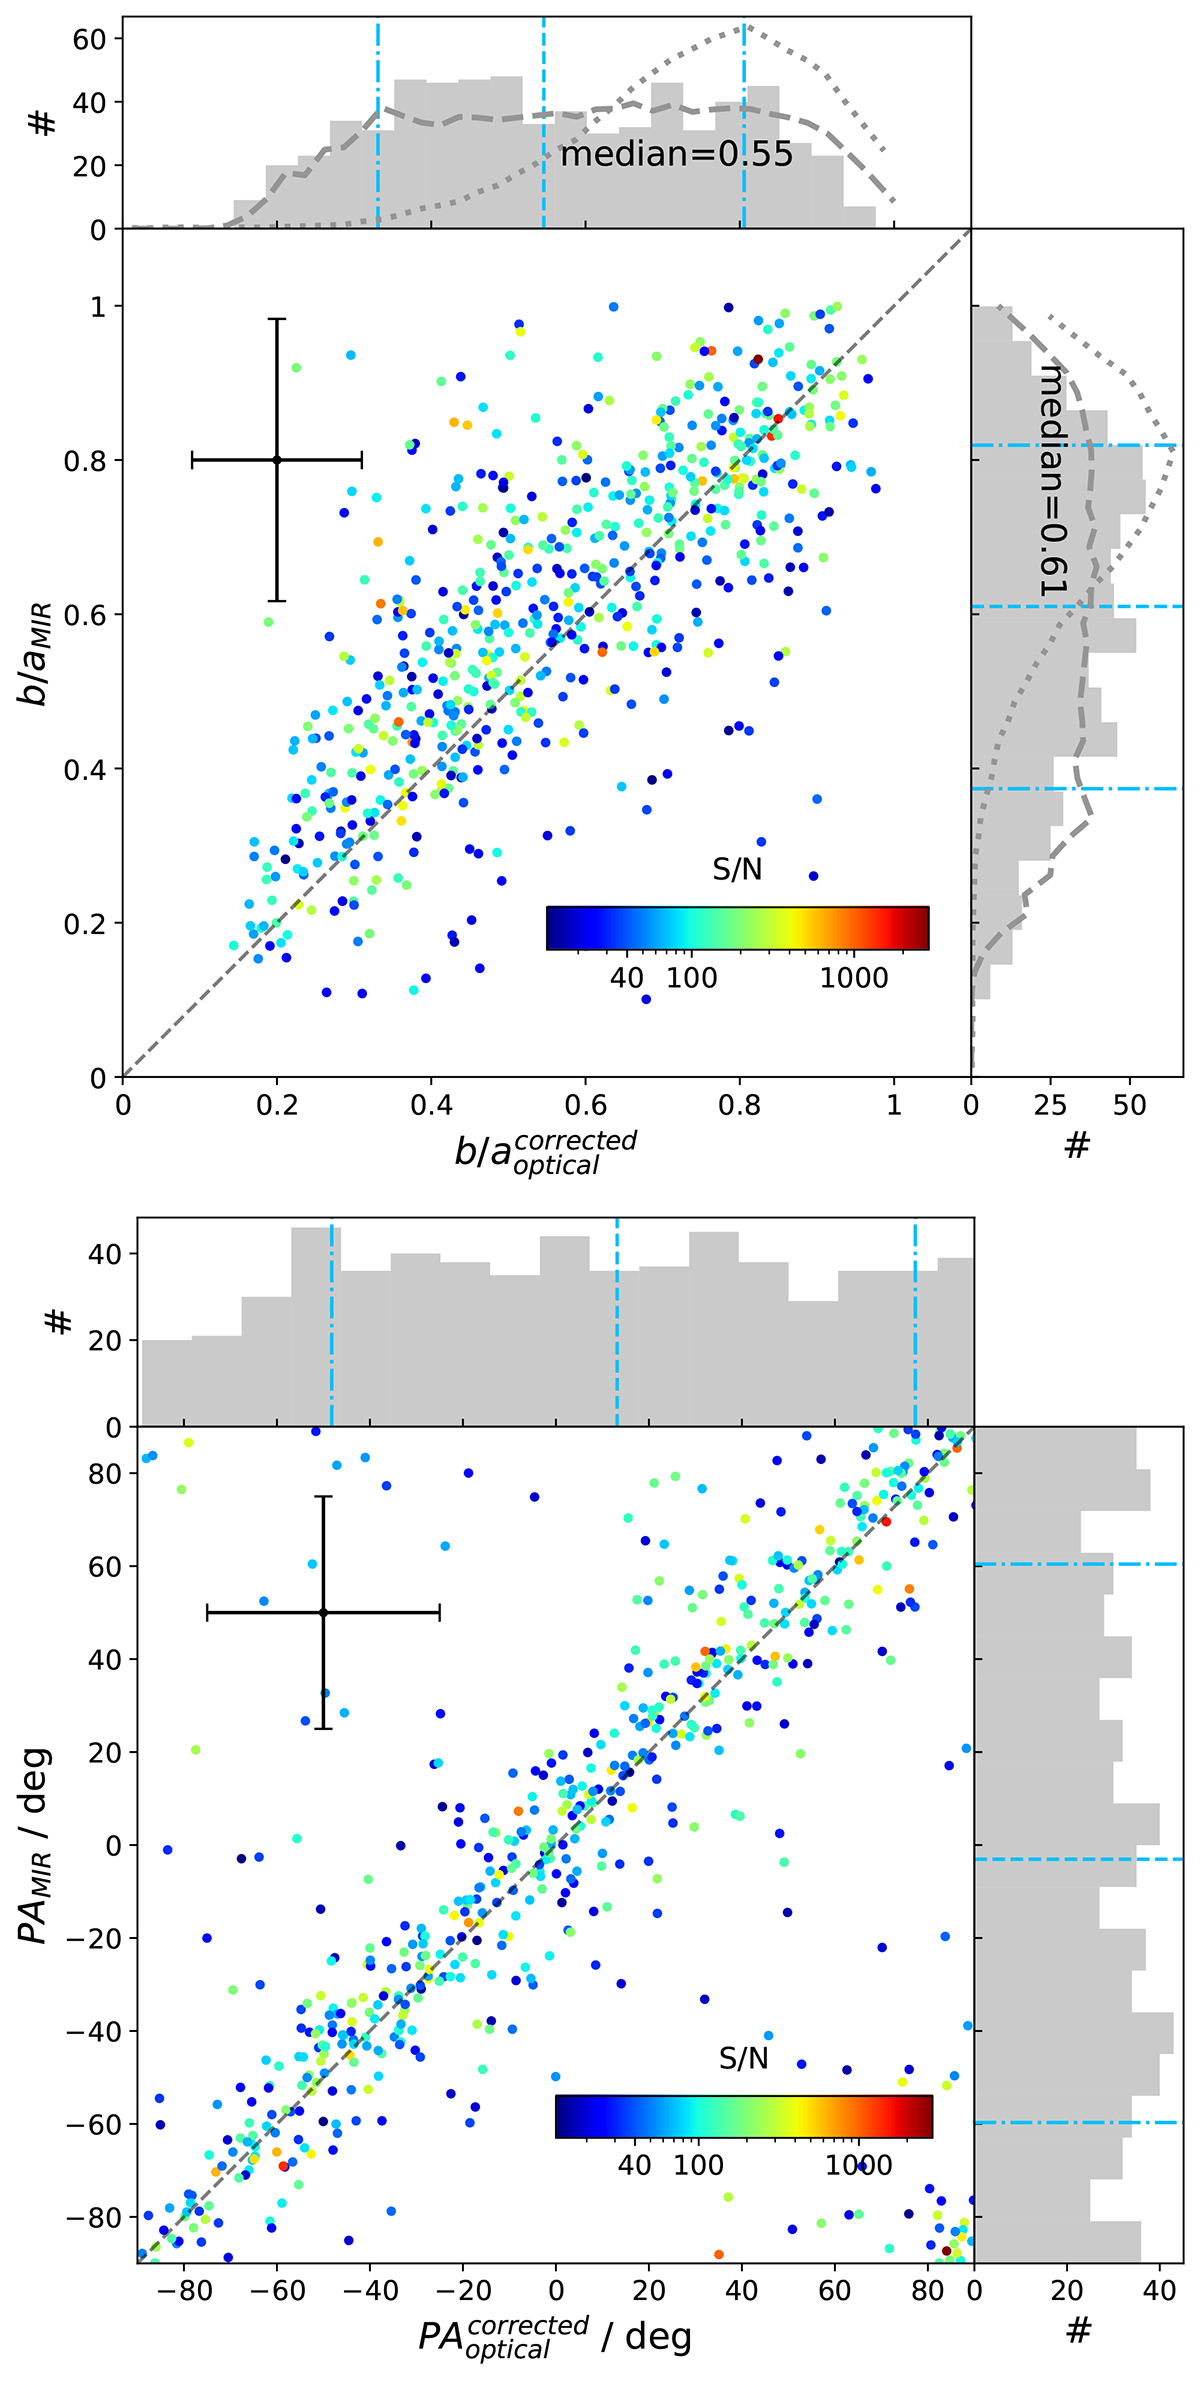
Fig. 6.
Download original image
Axis ratio and position angle comparison between the optical and MIR measurements for our SFGs using strategy 2. Galaxies are color-coded by their S/N. The dashed gray line shows the 1-to-1 line. Sidebars exhibit the corresponding distributions. The median and 16th/84th percentiles of these distributions are illustrated by the dashed and dash-dotted blue lines, respectively. The median error bar is shown in black. Dashed and dotted gray curves are axis ratio distributions of local spiral and elliptical galaxies, respectively, referred from Rodríguez & Padilla (2013). For the position angle, galaxies that are clustered in the lower right-hand corners of the graph are not really outliers. This appears due to the fact that at these high position angles, a galaxy can be fit indifferently with a 90 degree or -90 degree position angle.
Current usage metrics show cumulative count of Article Views (full-text article views including HTML views, PDF and ePub downloads, according to the available data) and Abstracts Views on Vision4Press platform.
Data correspond to usage on the plateform after 2015. The current usage metrics is available 48-96 hours after online publication and is updated daily on week days.
Initial download of the metrics may take a while.