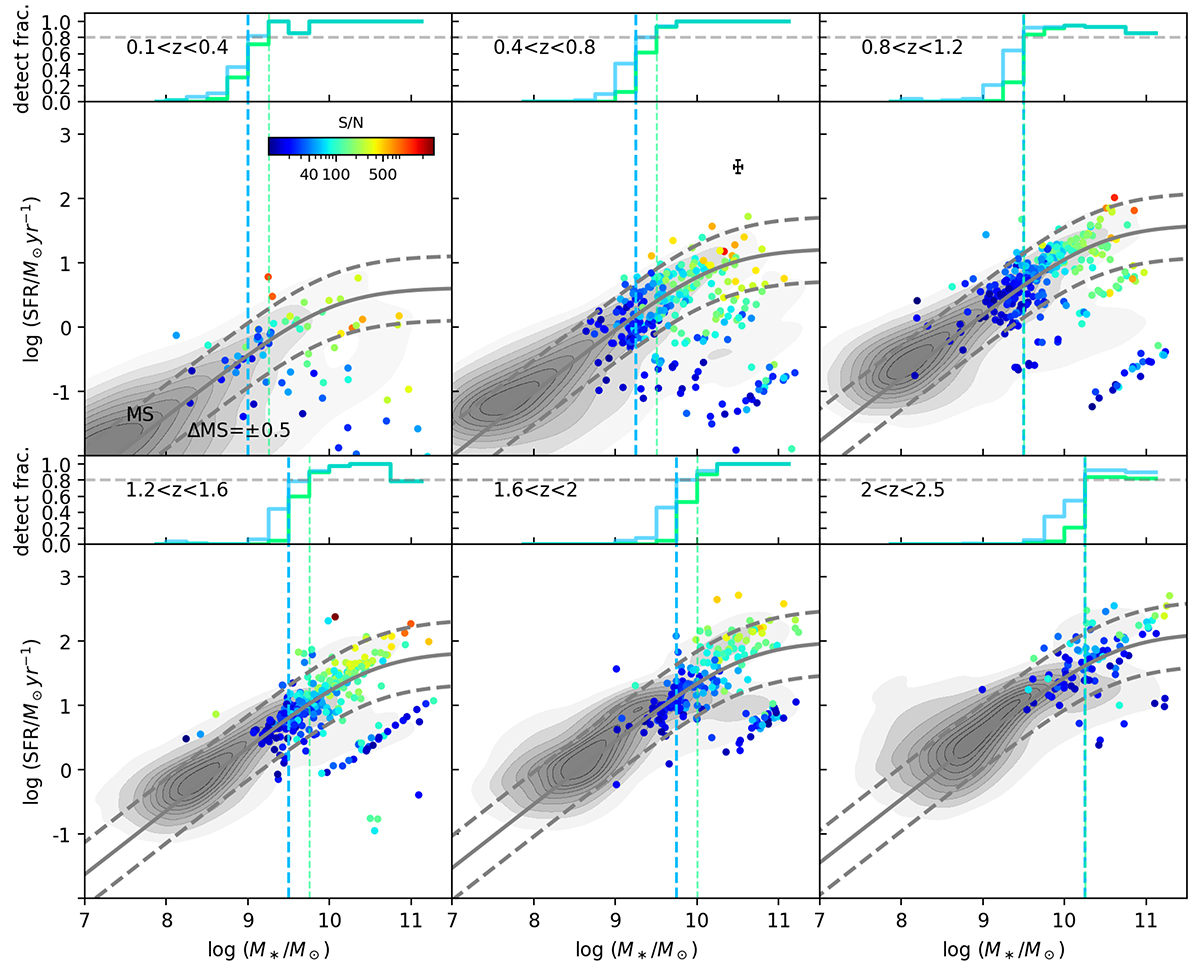
Fig. 4.
Download original image
SFR vs. stellar mass for the CANDELS×MIRI strategy 2 sample, grouped into six redshift bins from 0.1 to 2.5. The color of each point represents the S/N in MIR. Gray contours indicate the distribution of CANDELS galaxies falling on the PRIMER MIRI field of view. The solid gray curves are the main sequence of SFGs from Popesso et al. (2023). The SFR is normalized according to the median redshift in each bin by maintaining the distance to the main sequence. The dashed gray lines are ±0.5 dex from the main sequence. The green and blue histograms above exhibit the detection fraction of SFGs with ΔMS > −0.5 for strategy 1 (S/N ≥ 40) and strategy 2 (S/N ≥ 10) samples, respectively. The dashed vertical blue and green lines above display the 80% stellar mass completeness limits of these samples (compared with CANDELS). The median error bar is shown in black.
Current usage metrics show cumulative count of Article Views (full-text article views including HTML views, PDF and ePub downloads, according to the available data) and Abstracts Views on Vision4Press platform.
Data correspond to usage on the plateform after 2015. The current usage metrics is available 48-96 hours after online publication and is updated daily on week days.
Initial download of the metrics may take a while.